Marketing Campaign
With this example project you get a comprehensive overview of how to evaluate the data of a marketing project and how to use it for further steps.
Accessing the Marketing Campaign Sample#
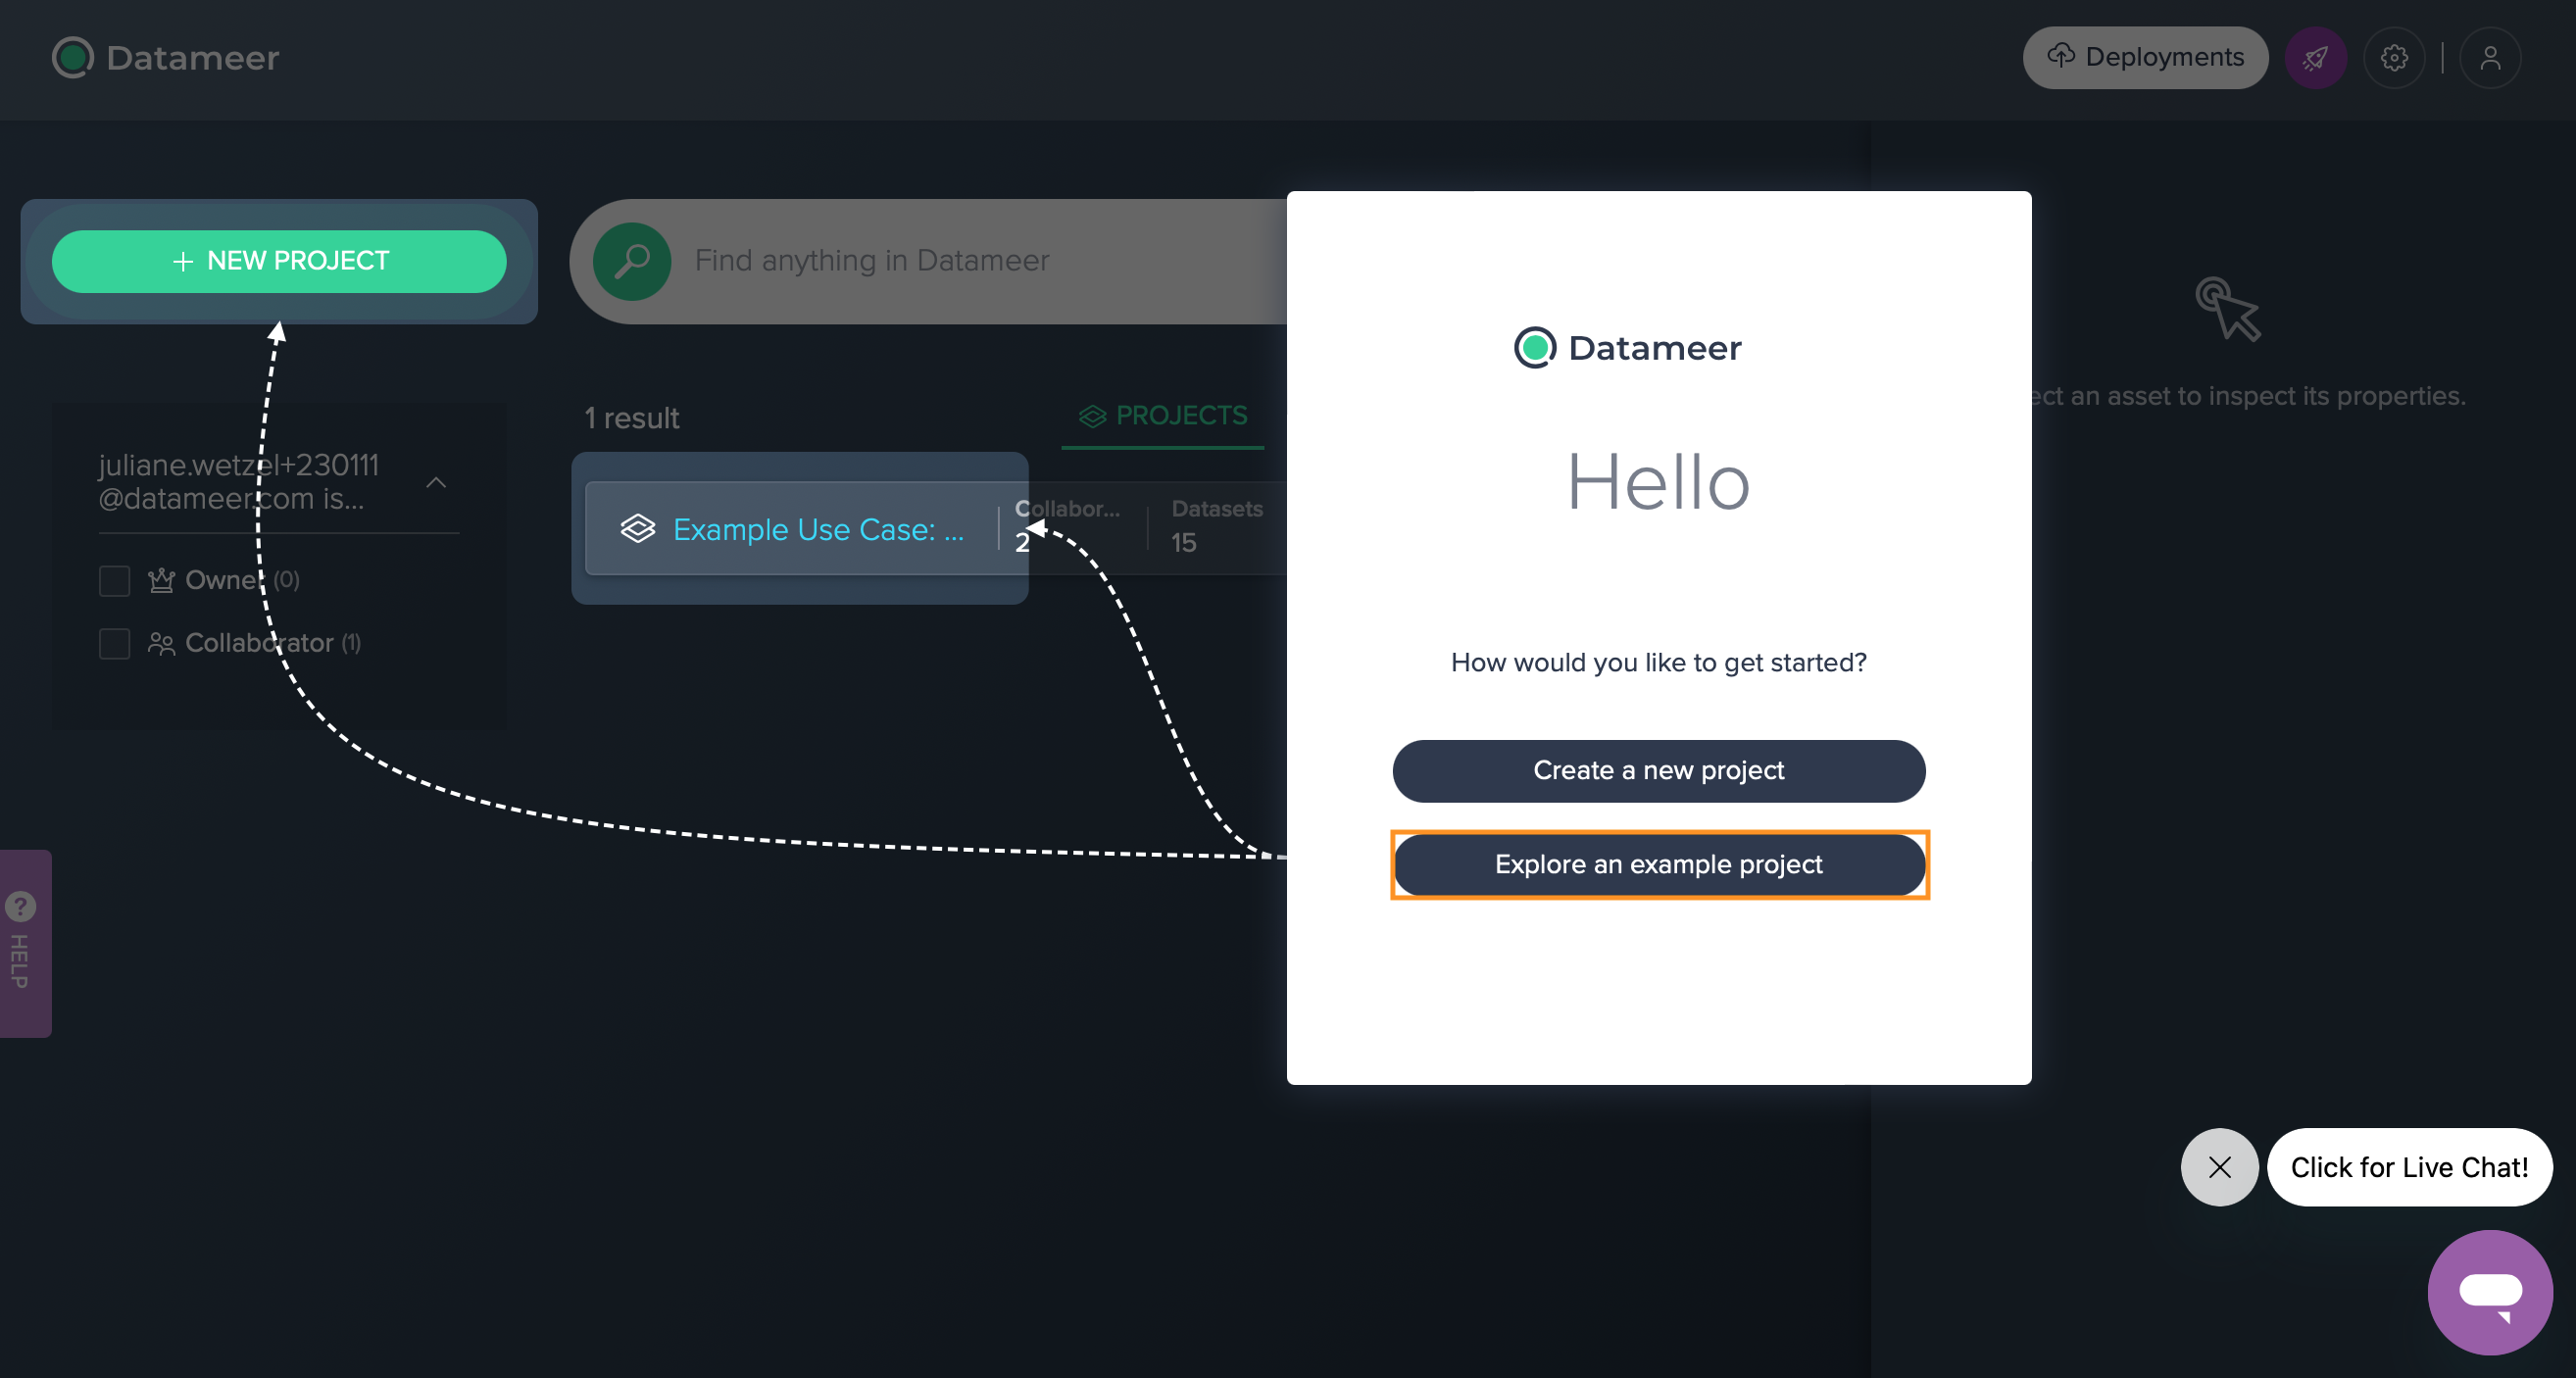
After signing up and changing your password you will be asked how you would like to start exploring Datameer:
- with a new Project
- open a sample use case
Clicking on "Open an example project" directly leads you to this specific Marketing Campaign Project.
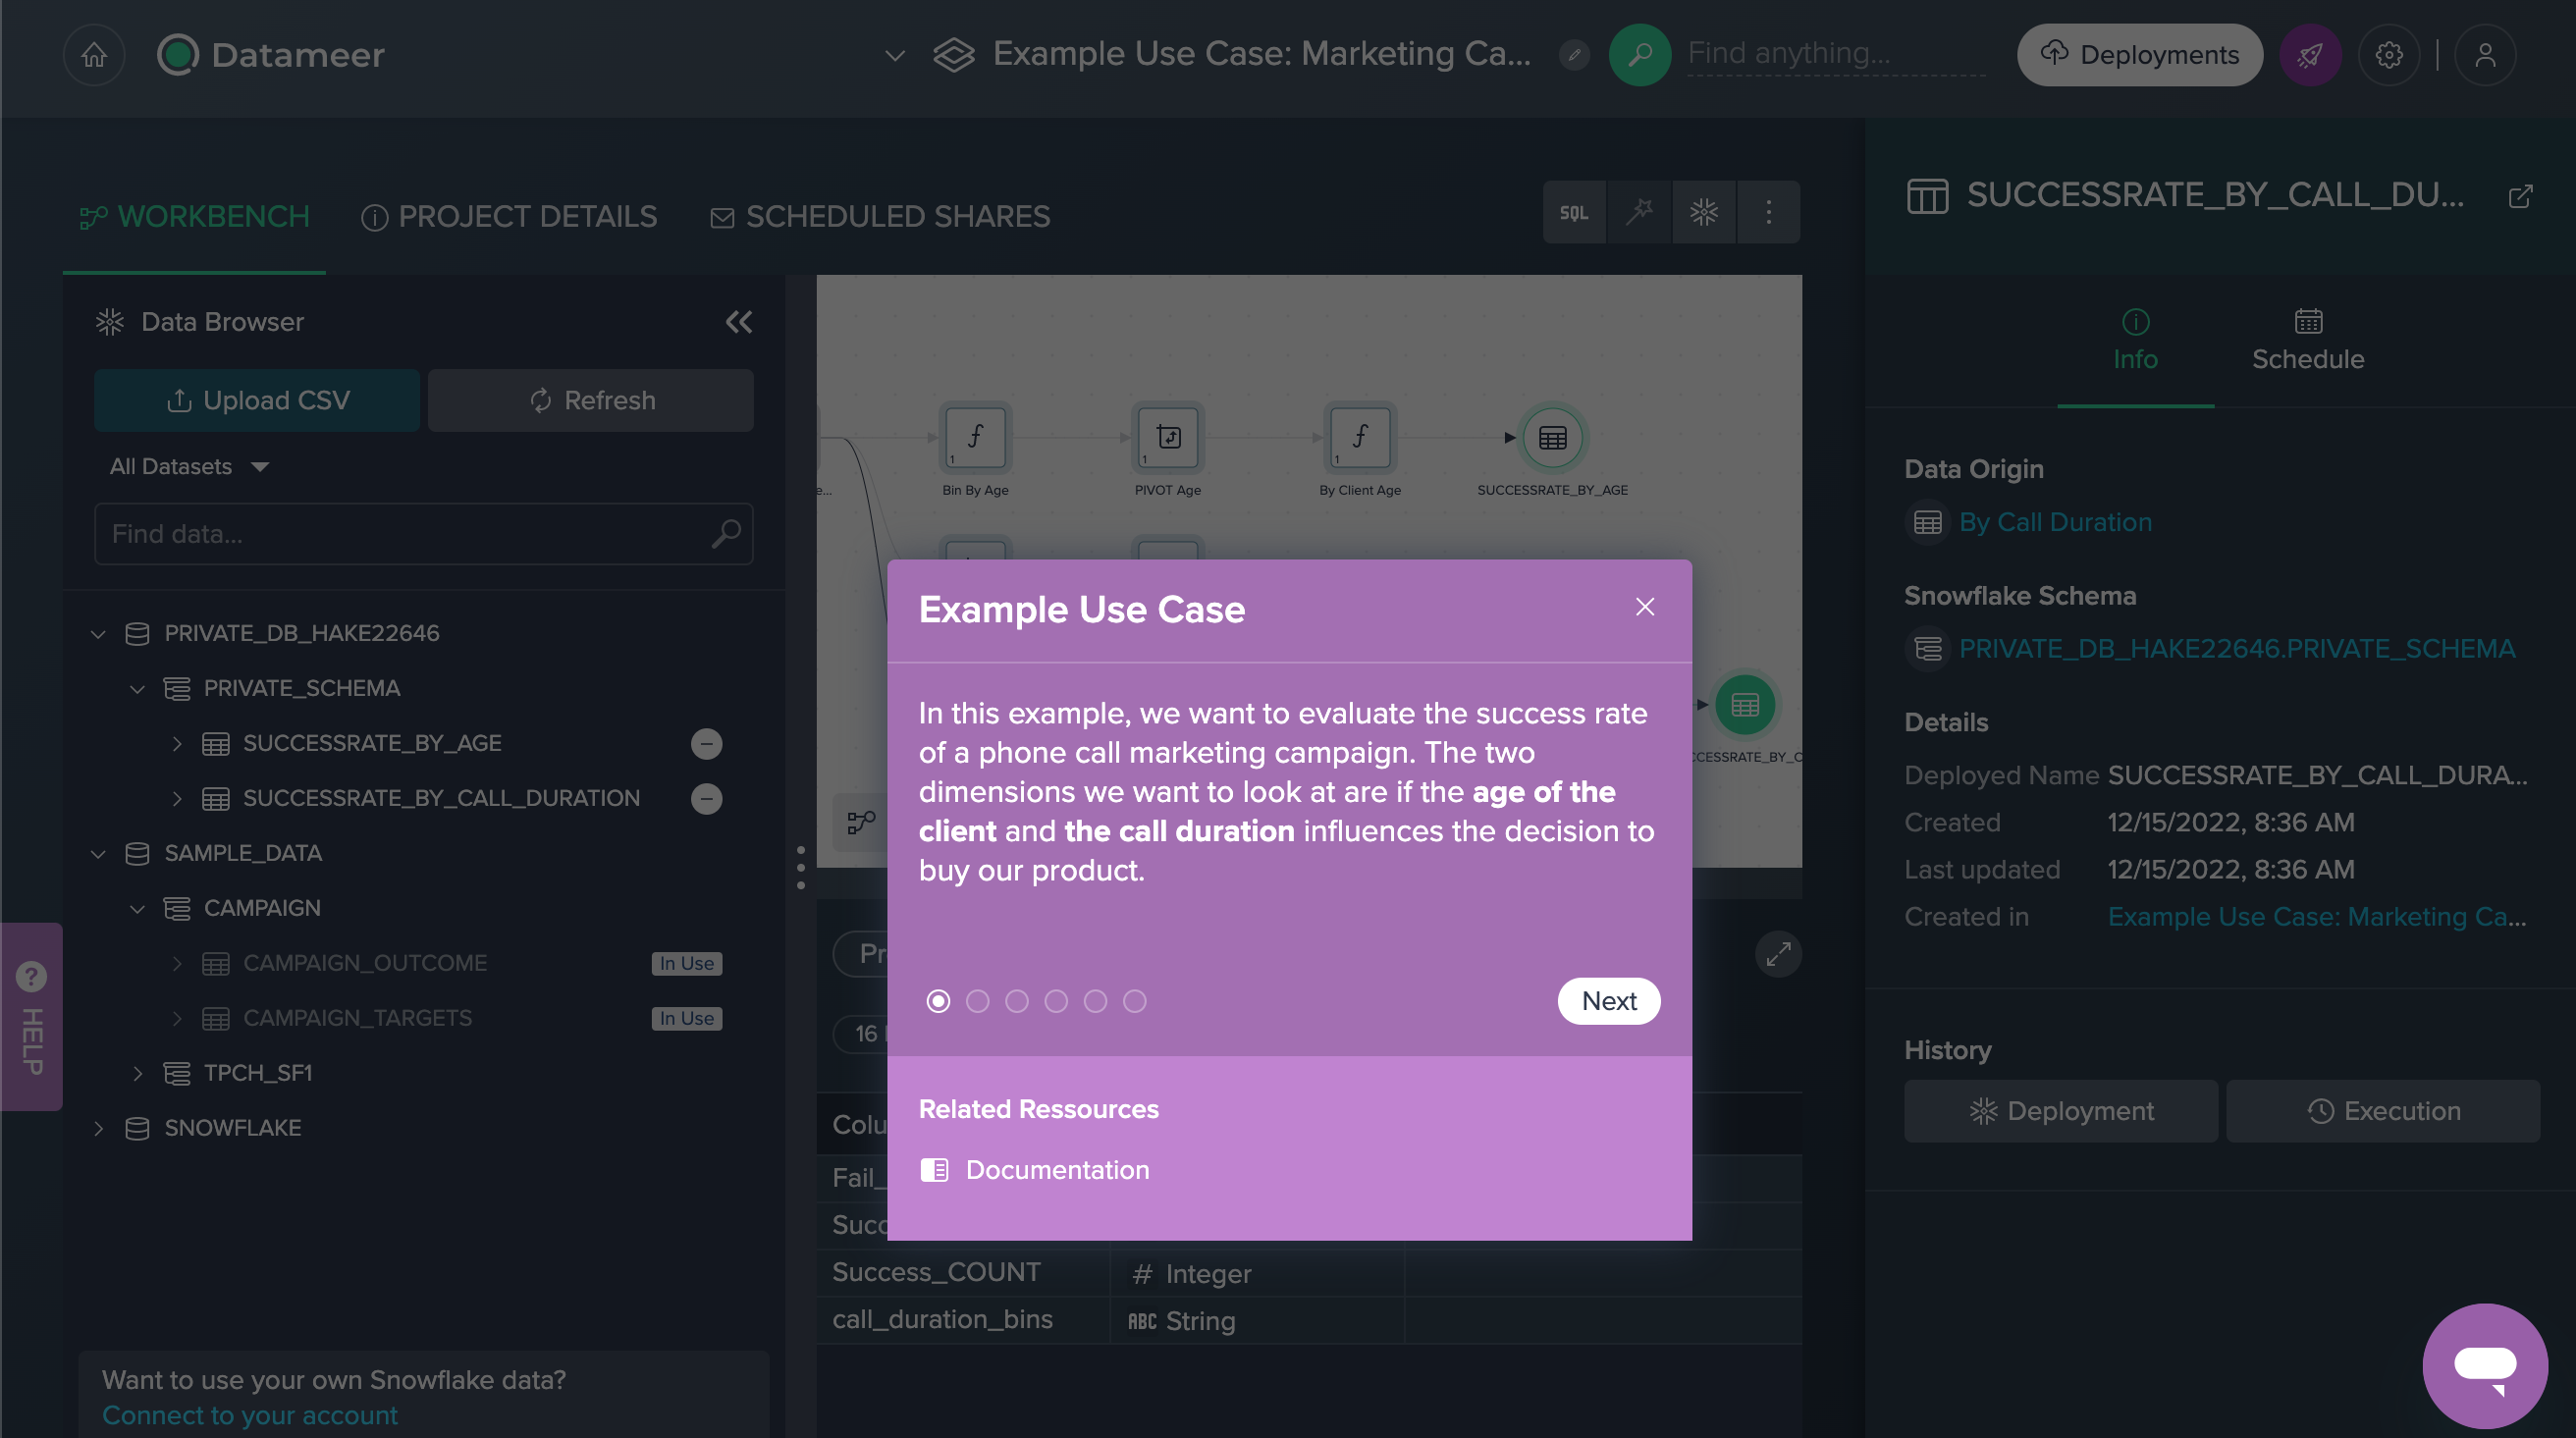
Campaign Goal#
A Portuguese banking institution called potential customers to sell their products via phone. They now try to figure out whether the campaign has been successful with some of the data from the Project's source dataset. Often, more than one contact to the same client was required, in order to access if the product (a bank term deposit) would be subscribed or not.
The bottom line was that two dimensions were considered: first, whether there is a particular age group that is more receptive to selling on the phone in general and, on the other hand, whether the length of the phone call affects a successful sale.
Source Data#
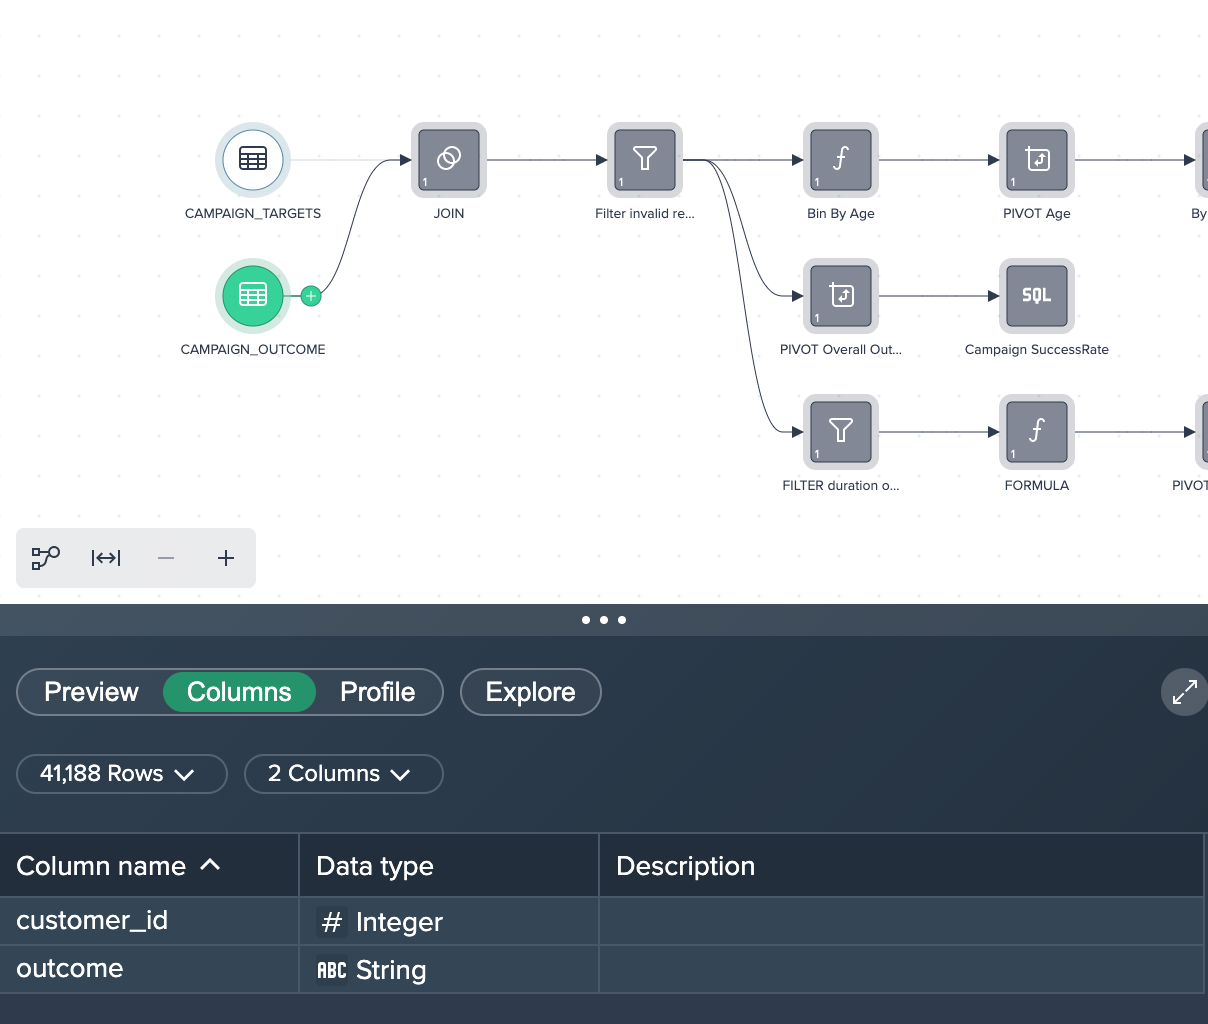
We have two source data sets added from the Data Browser, each containing data on customers and success. For each source dataset, the column name, data type and a description are available in the 'Columns' tab in the Data Grid.
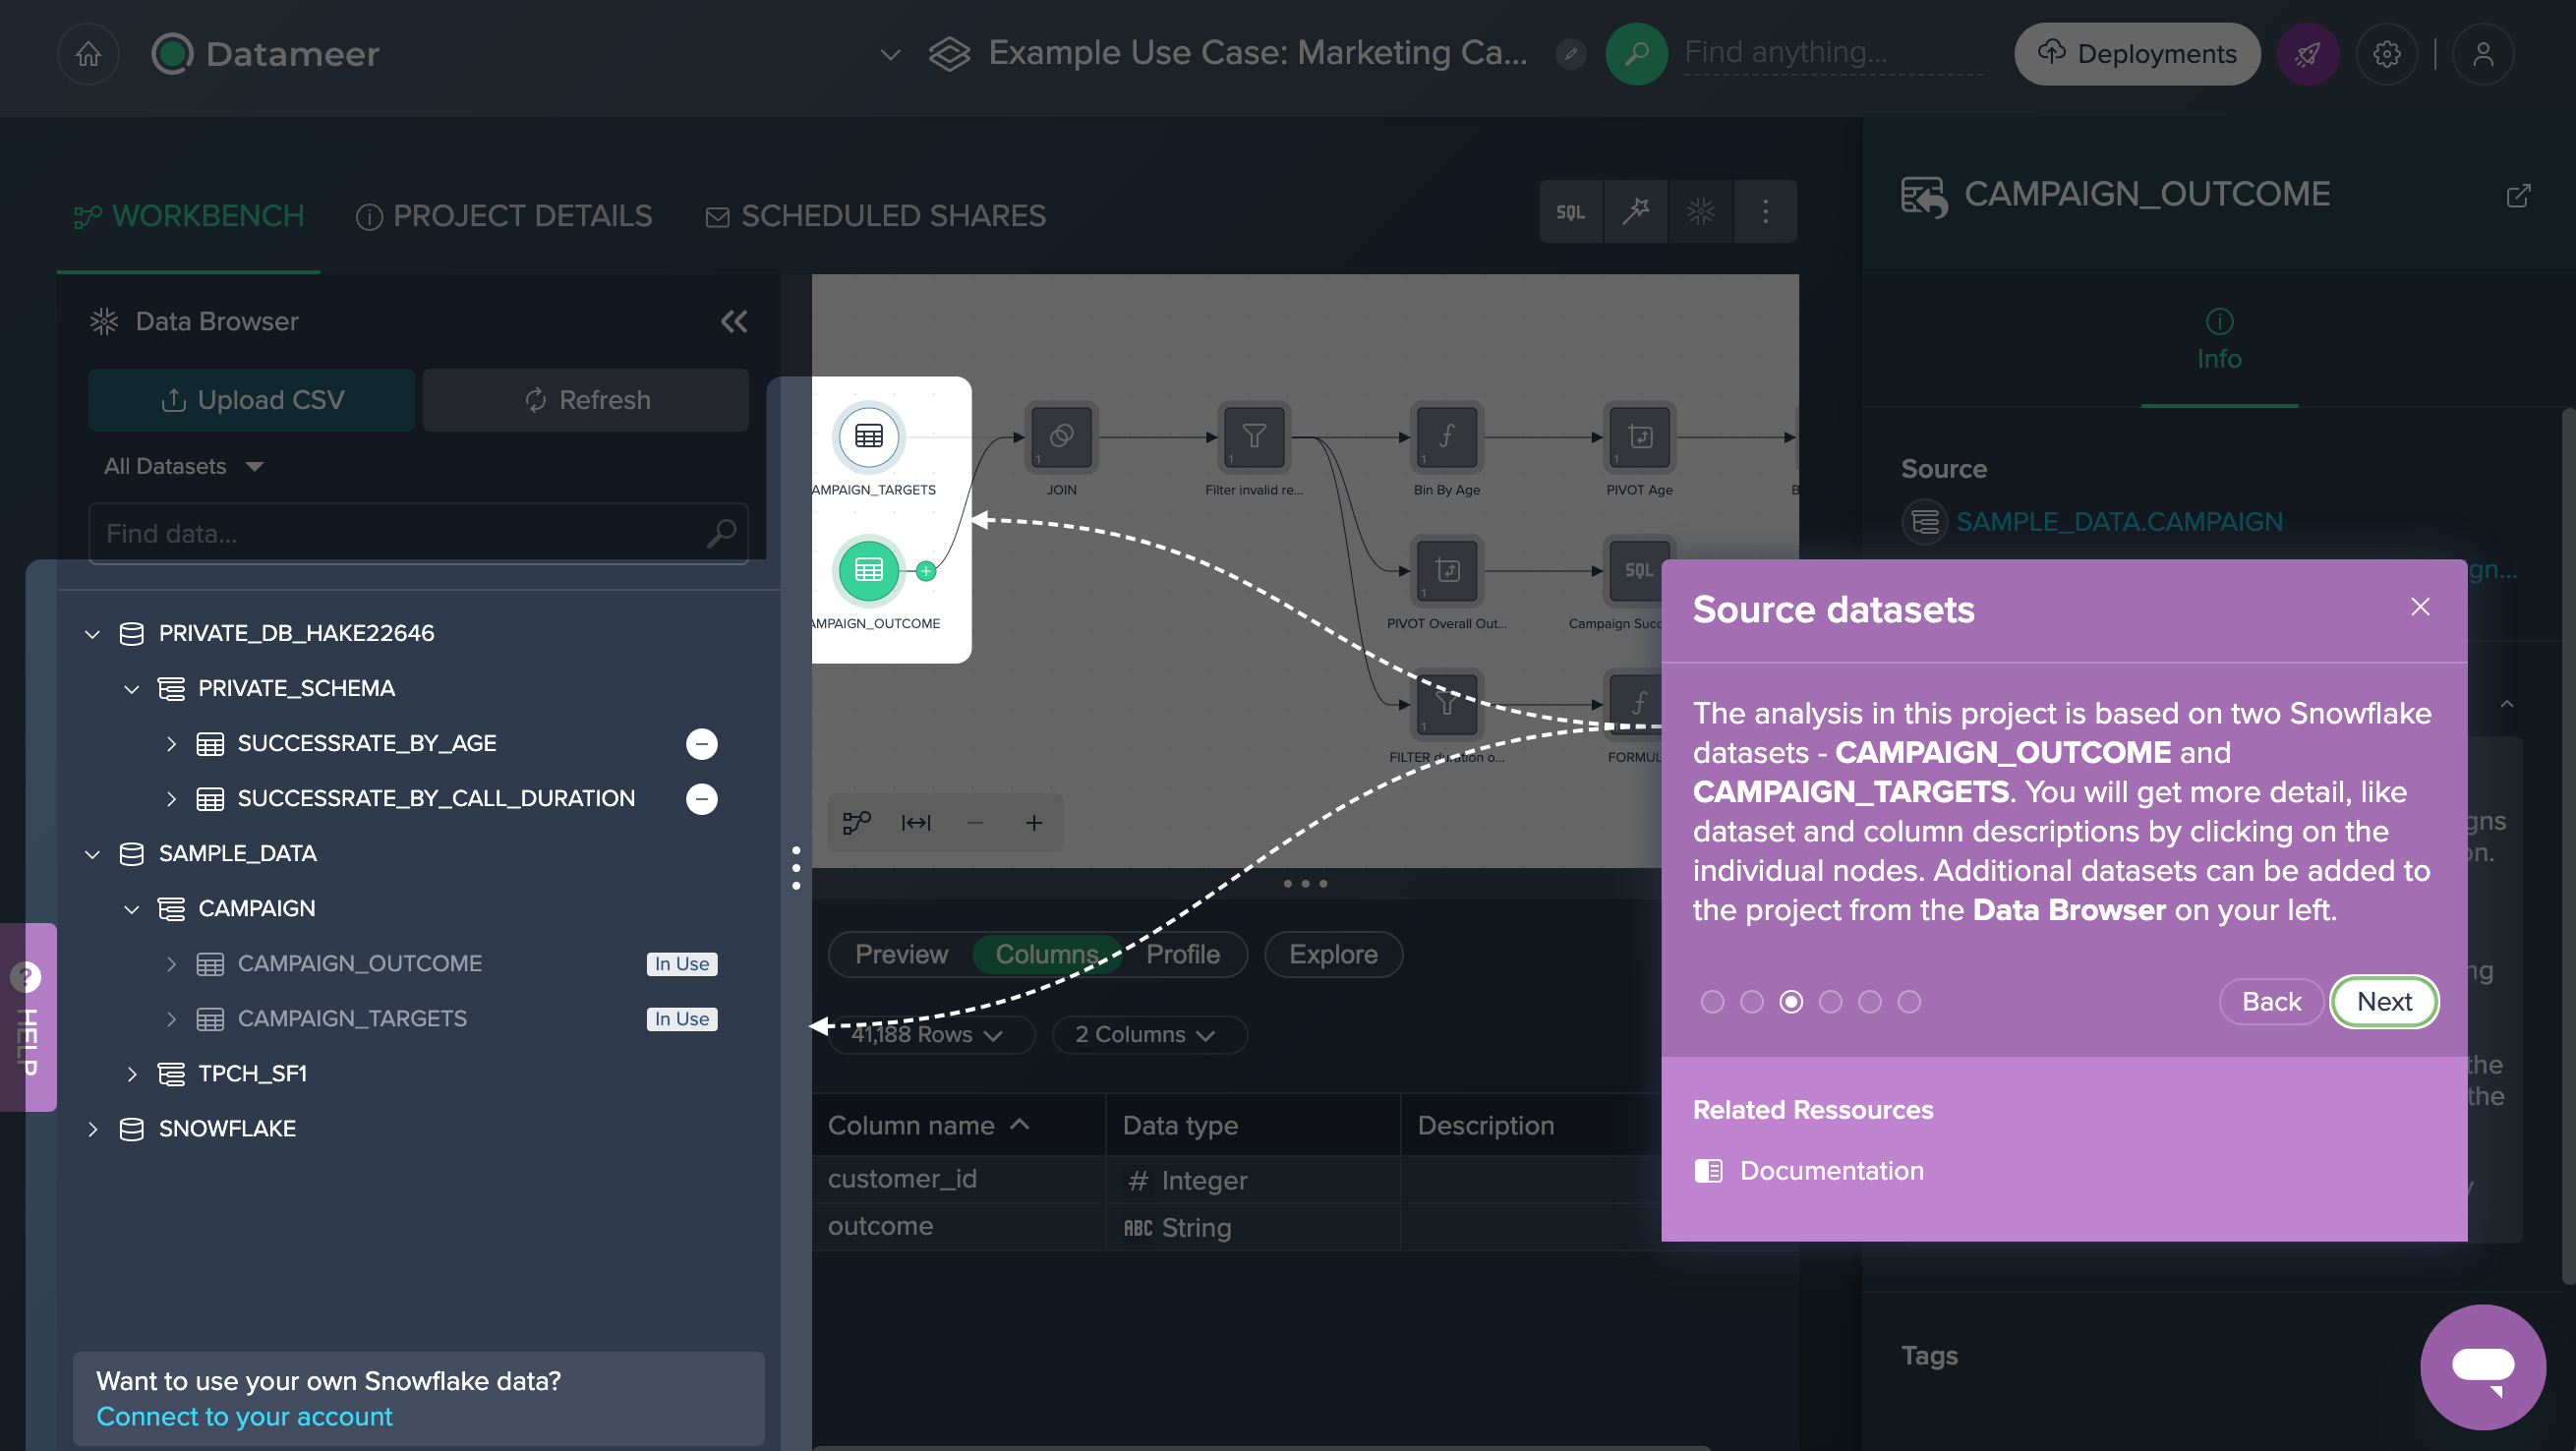
CAMPAIGN_OUTCOME contains two columns; 'customer_id' contains data from type INTEGER and contains all unique client IDs, 'outcome' contains STRING data and contains the information, whether or not the client has purchased the product.
CAMPAIGN_TARGETS contains 22 meta data columns for all the clients, like 'age', 'housing', 'job'.
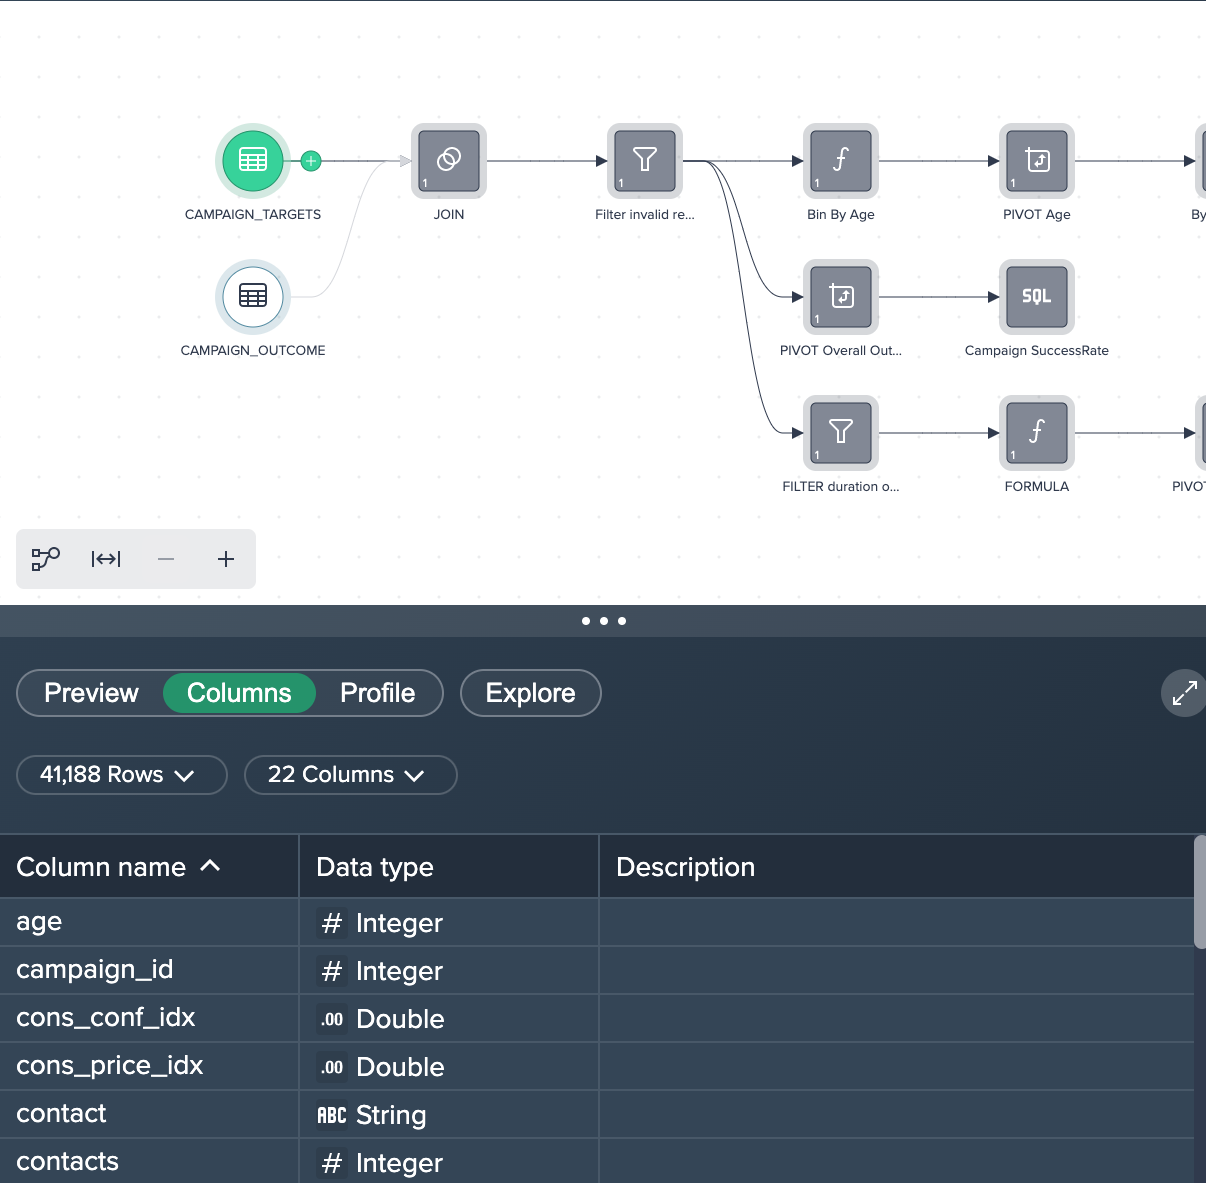
Transformation#
To achieve the desired results, different operations (no-code, low code, SQL) are used, starting from the Flow Area.
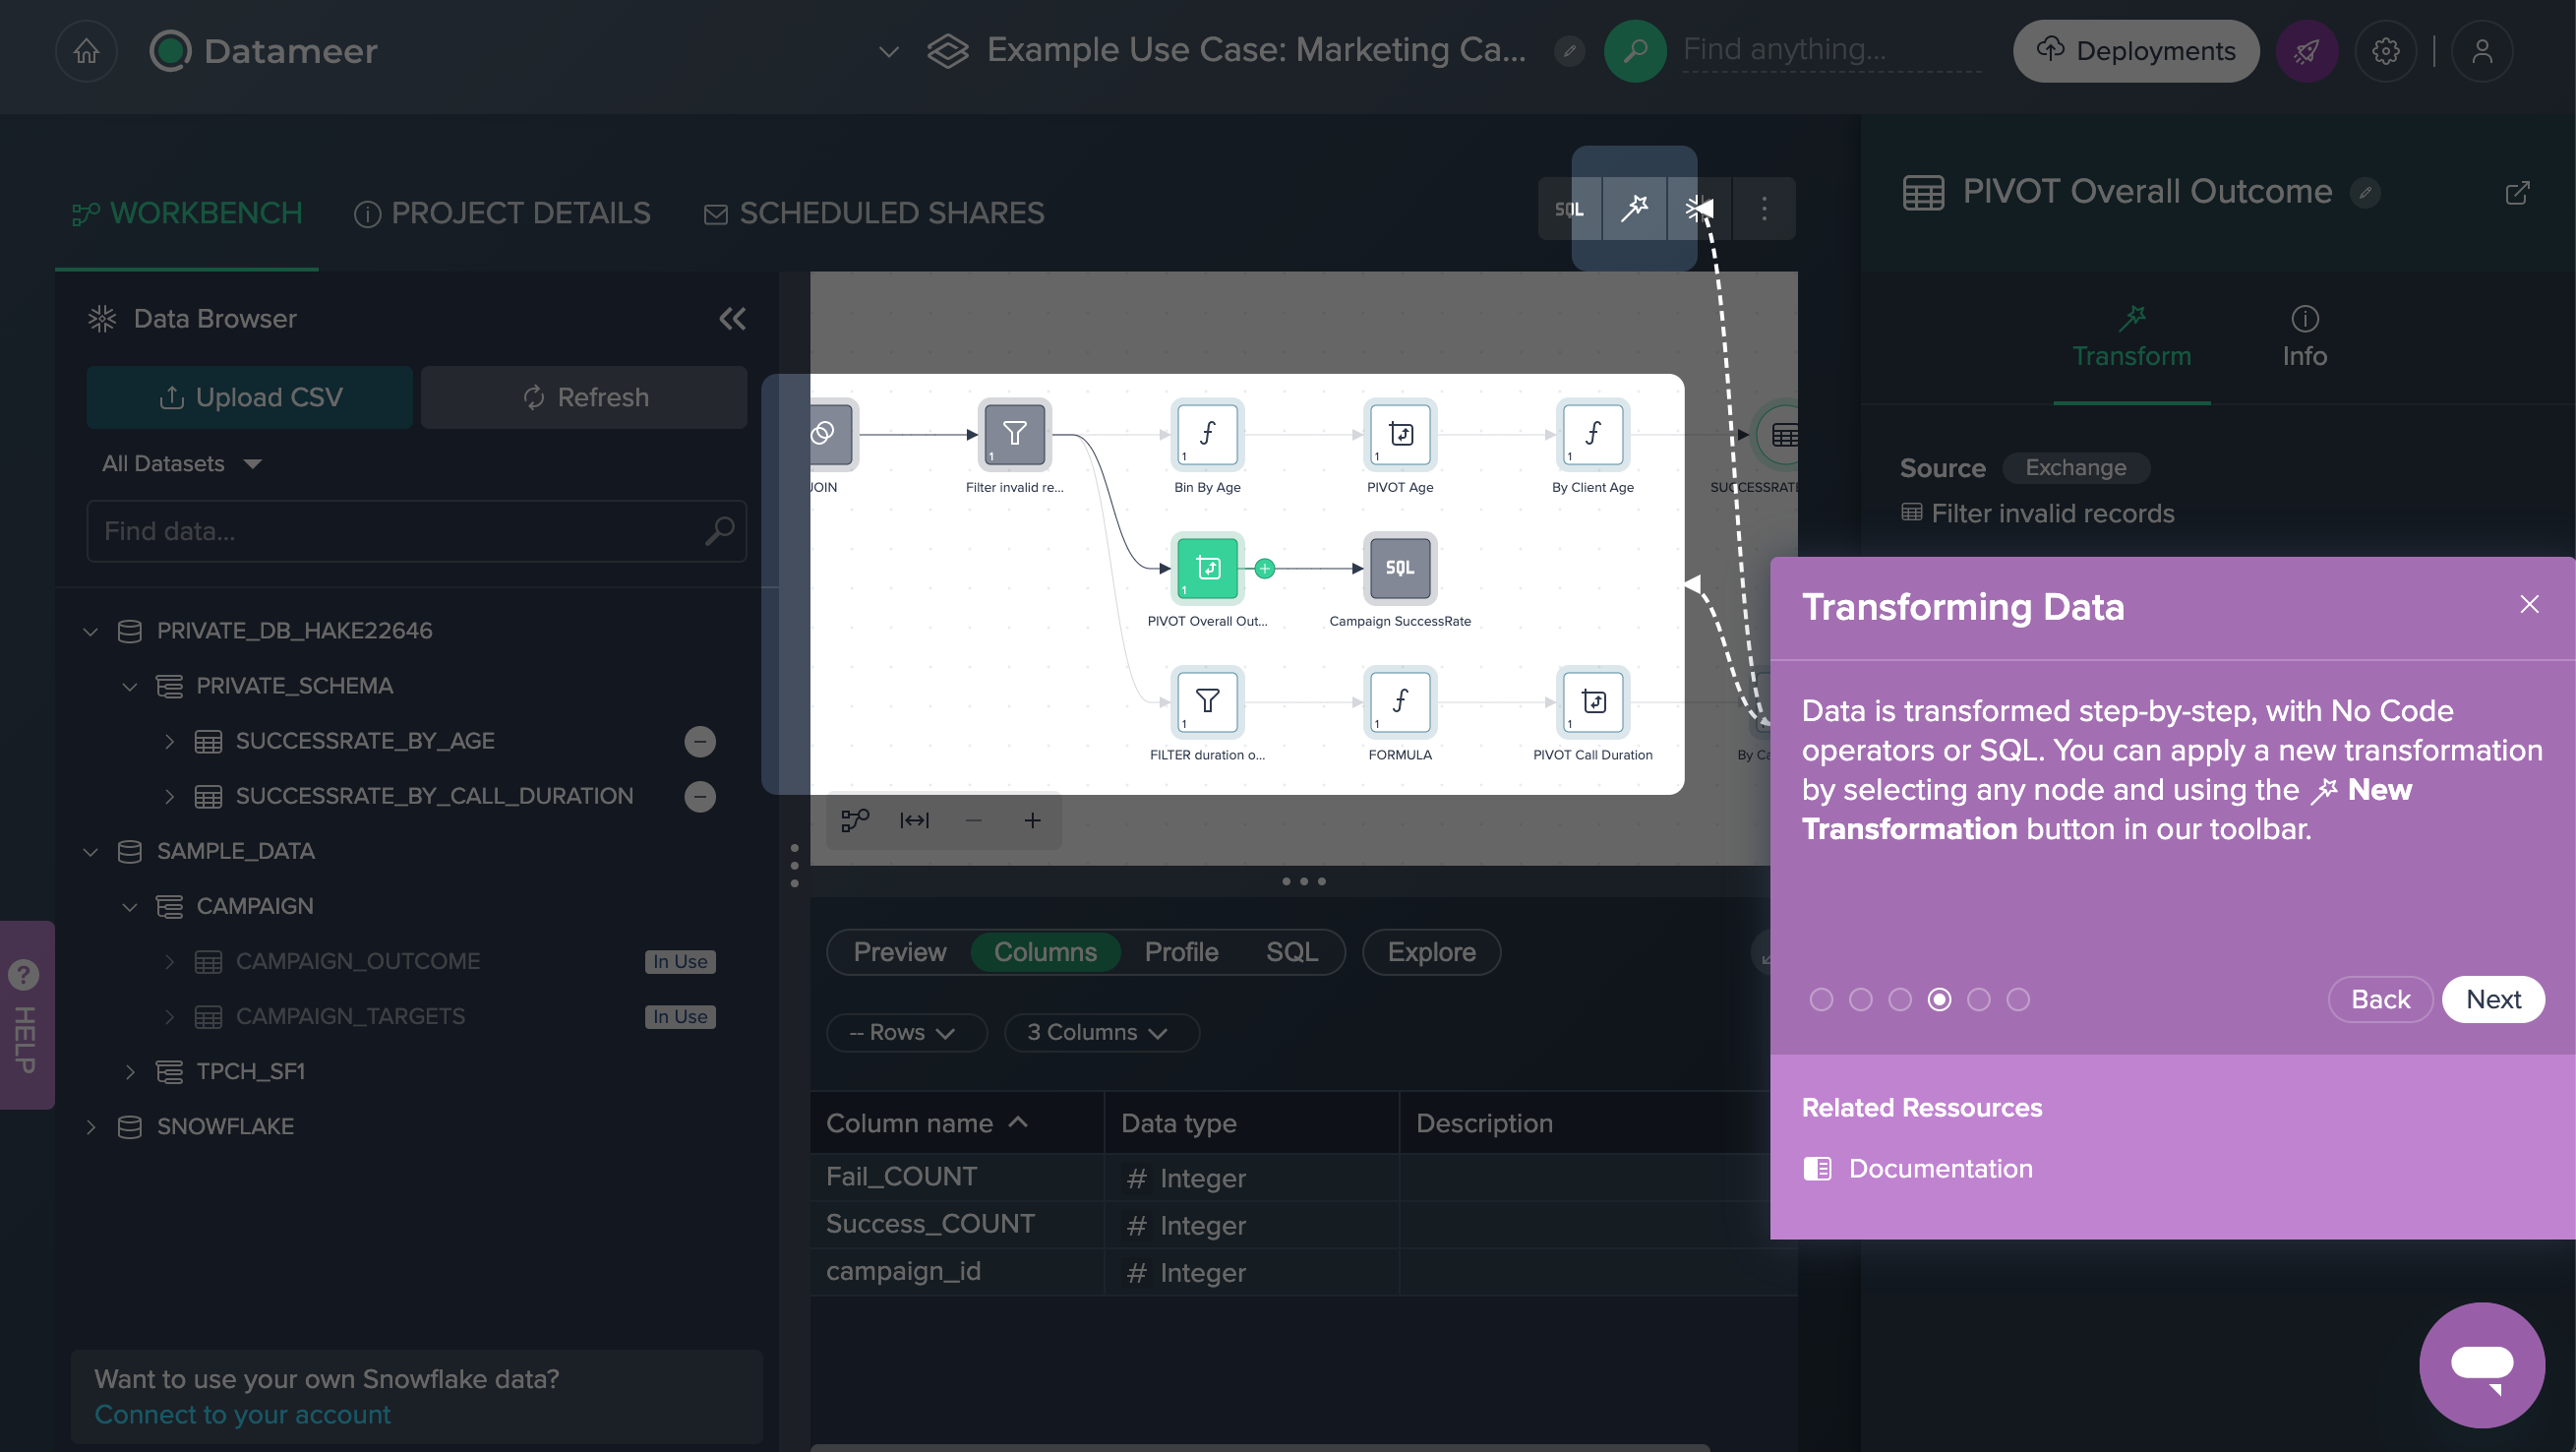
Data Preparation#
First the source data needs some preparation.
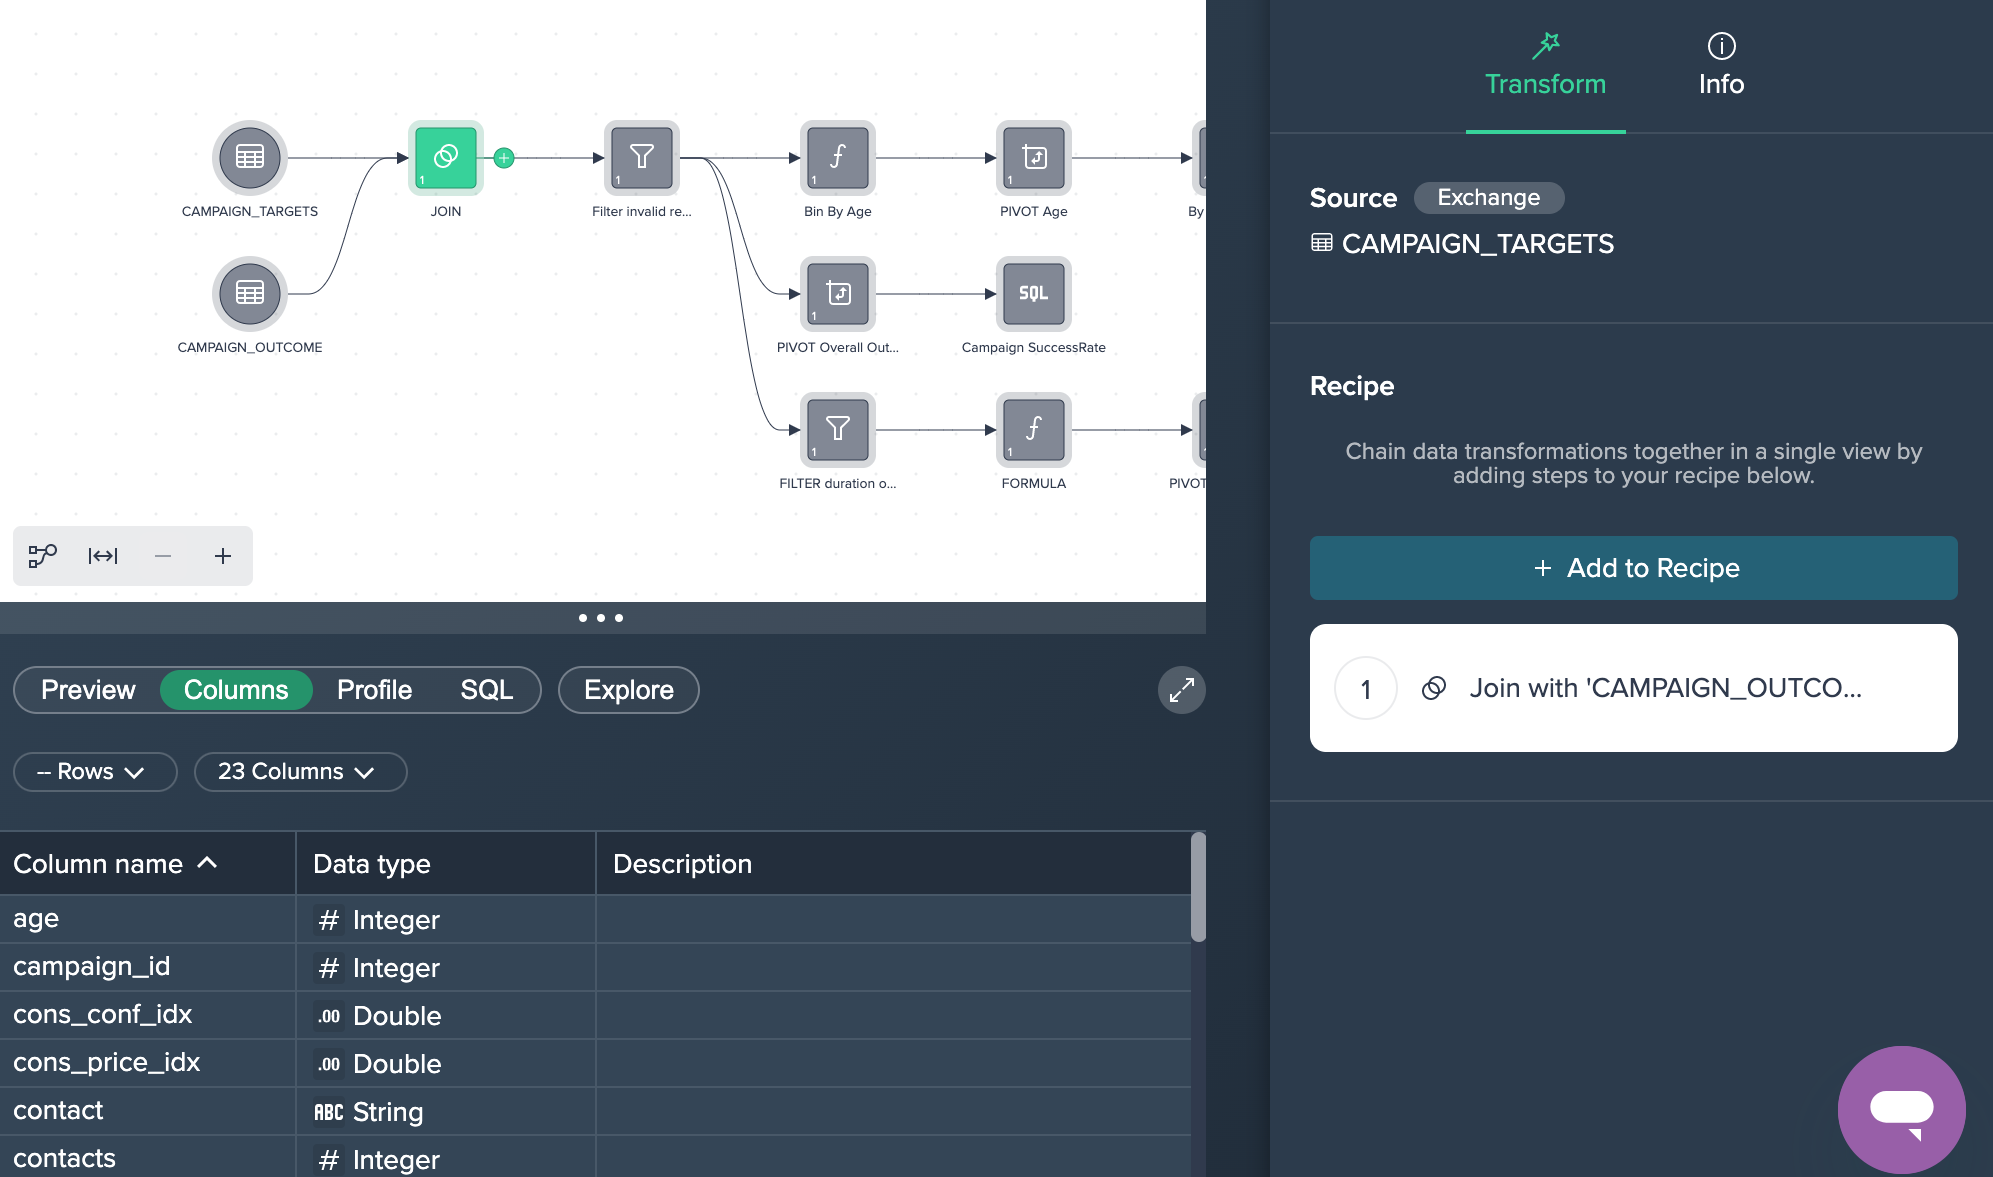
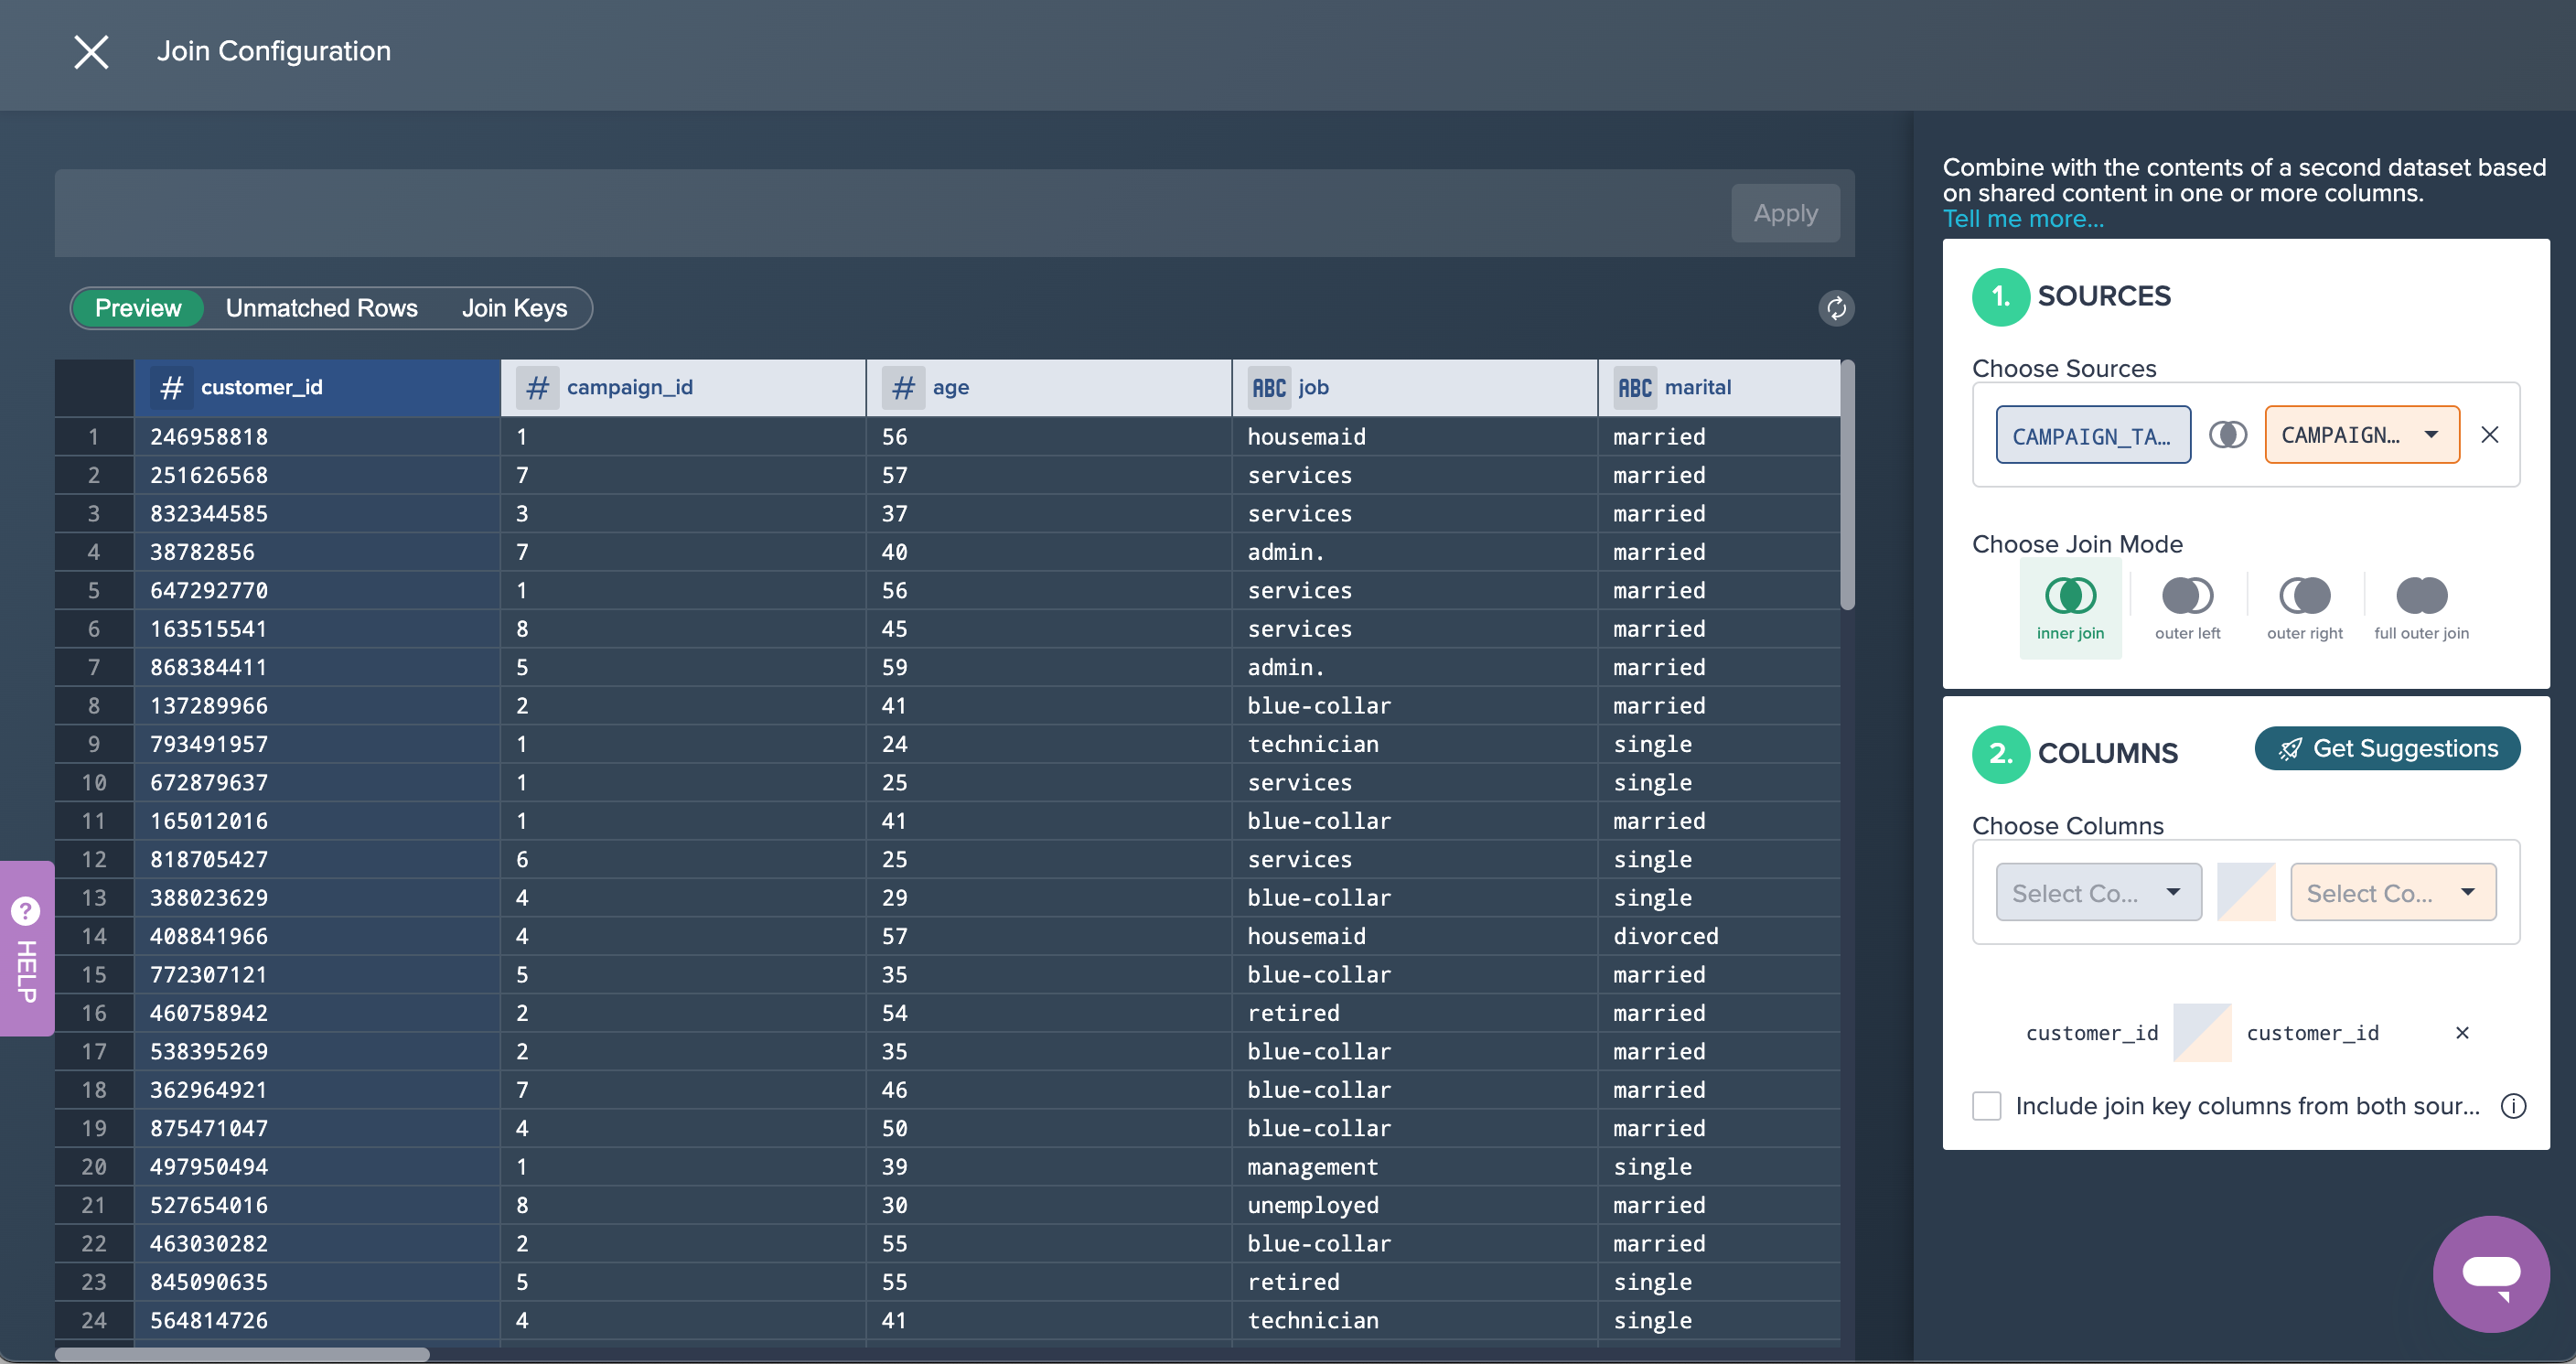
1. Joining both datasets: Both source data sets have been joined using their 'customer_id' columns in order to add the 'outcome' for each client. This was achieved by applying the no-code operation 'JOIN' to both data sets. You can view, edit or delete this operation in the Recipe on the right.
2. Filtering Data: The joined data sets has some records with invalid values and therefore all rows where the clients age is '-1' has been filtered out. This was done by applying the no-code operation 'FILTER'.
Success Rate by Age#
The first goal is to achieve the success rate by age.
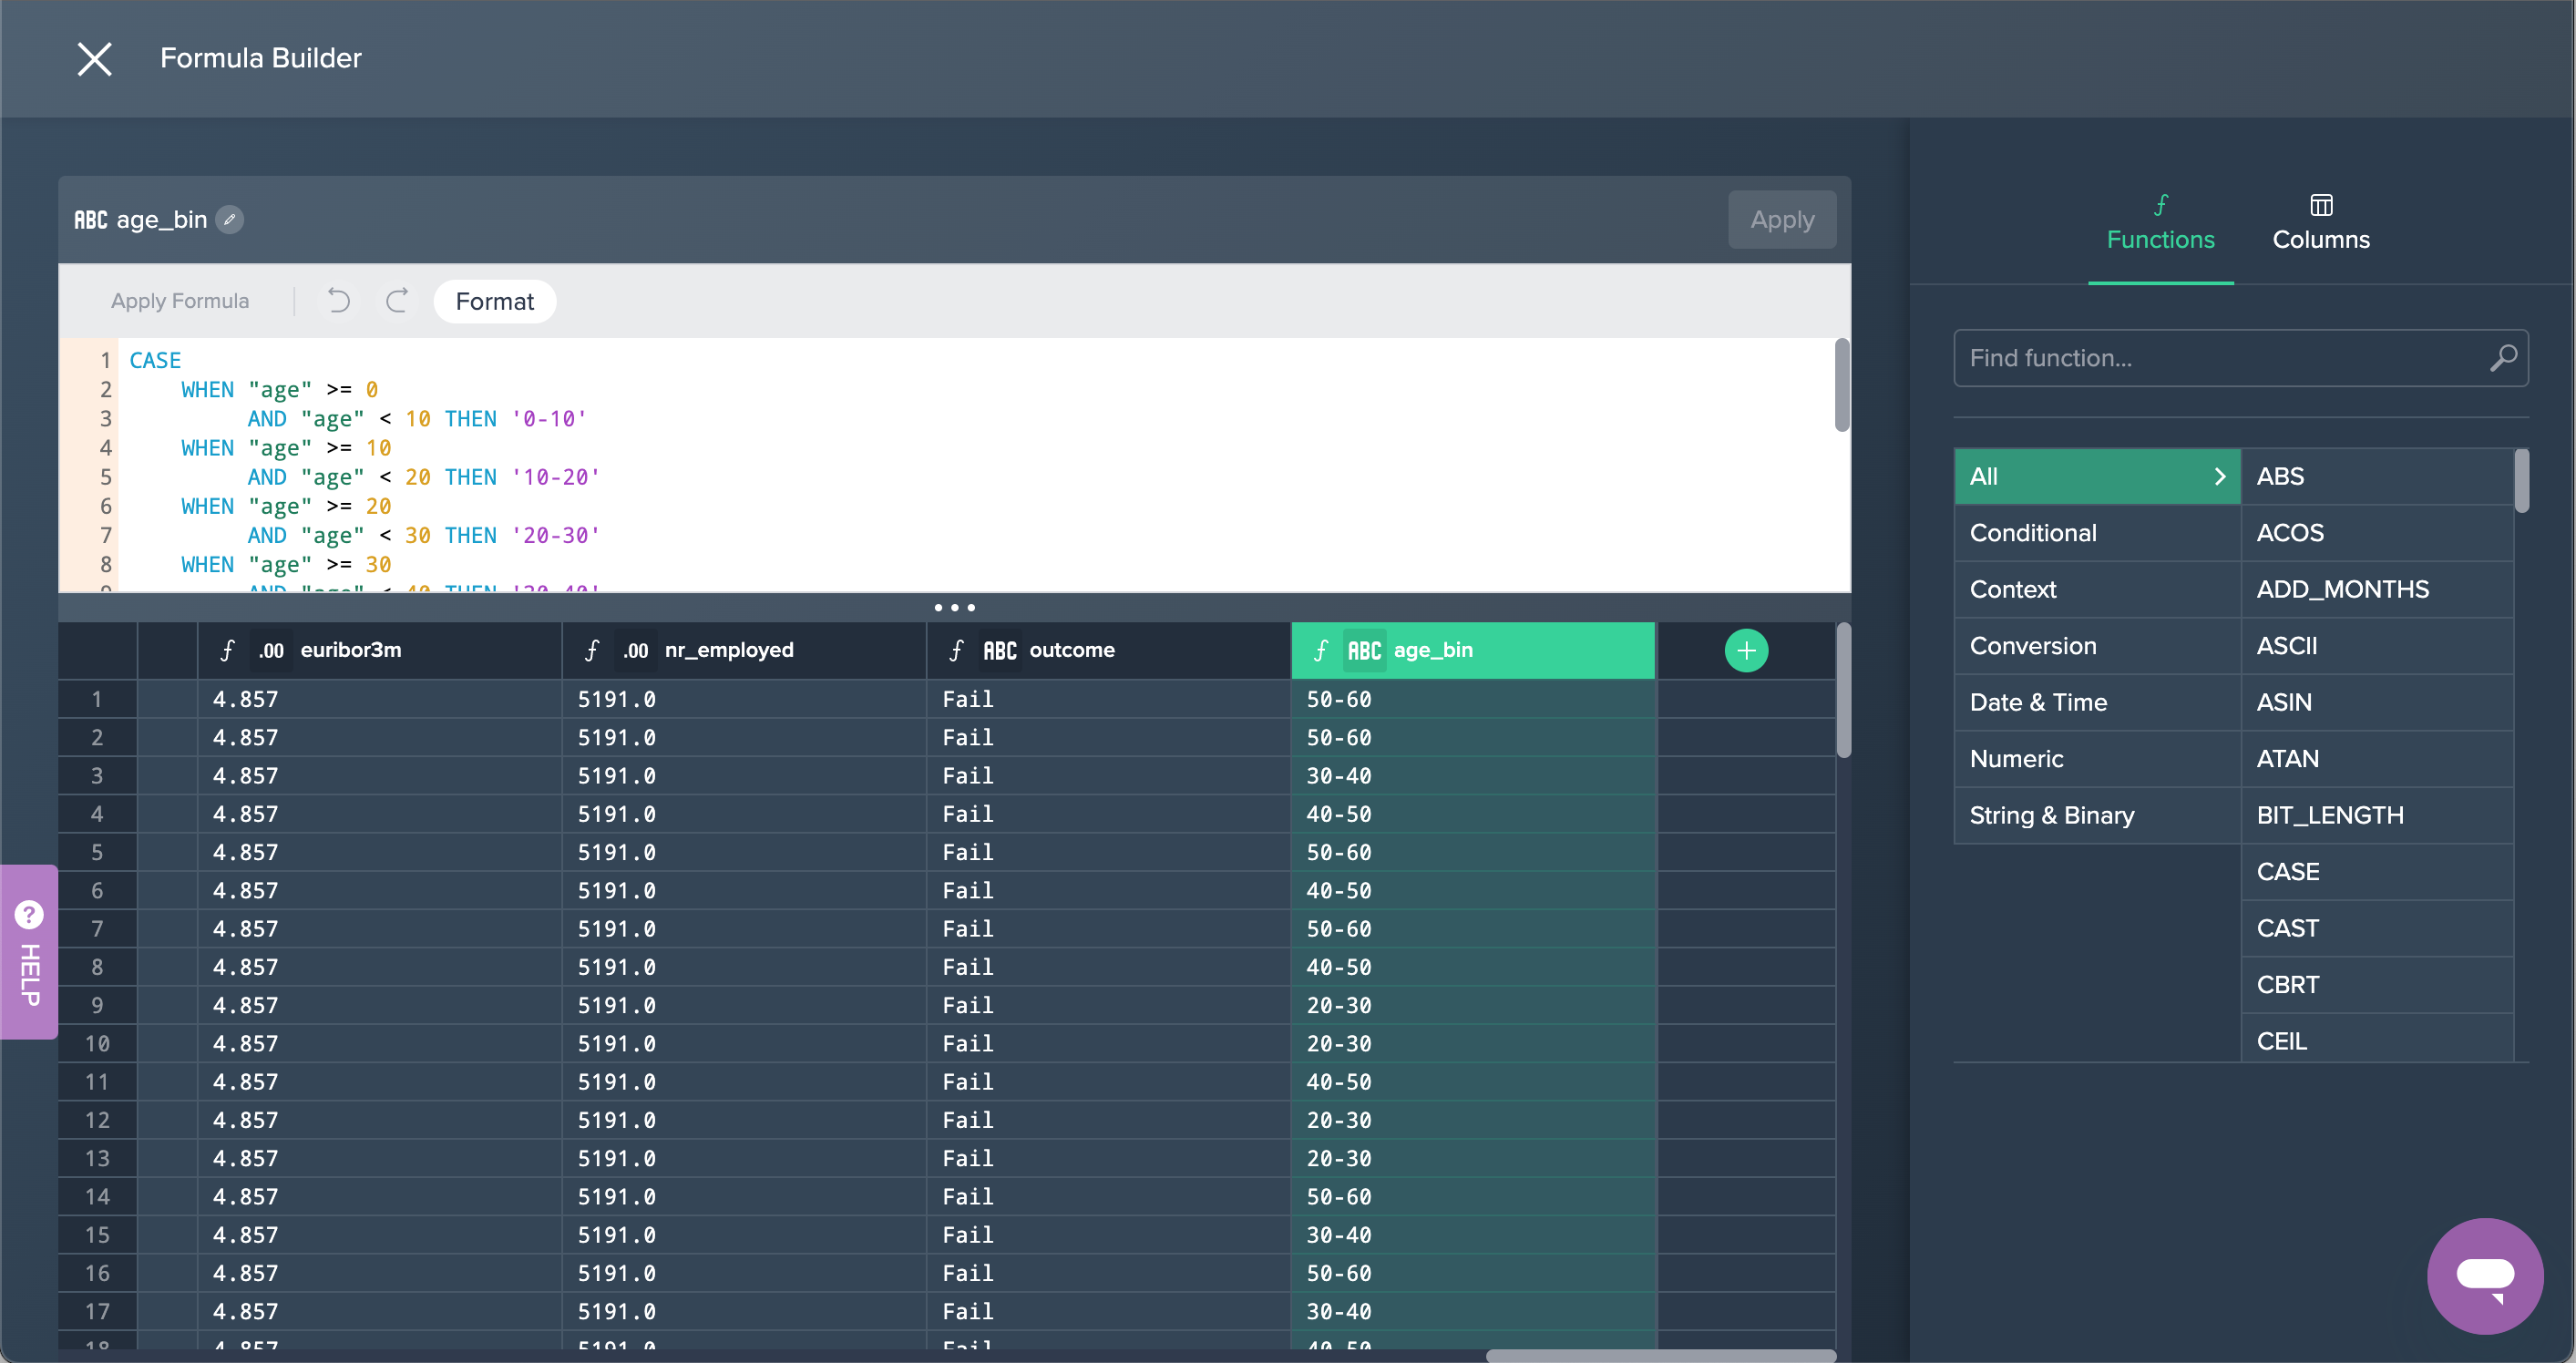
1. Bin By Age: The new column 'age_bin' has been derived where the age is binned into buckets of 10 years (age: 0-10, 10-20,...). This was done by applying a formula in the Formula Editor.
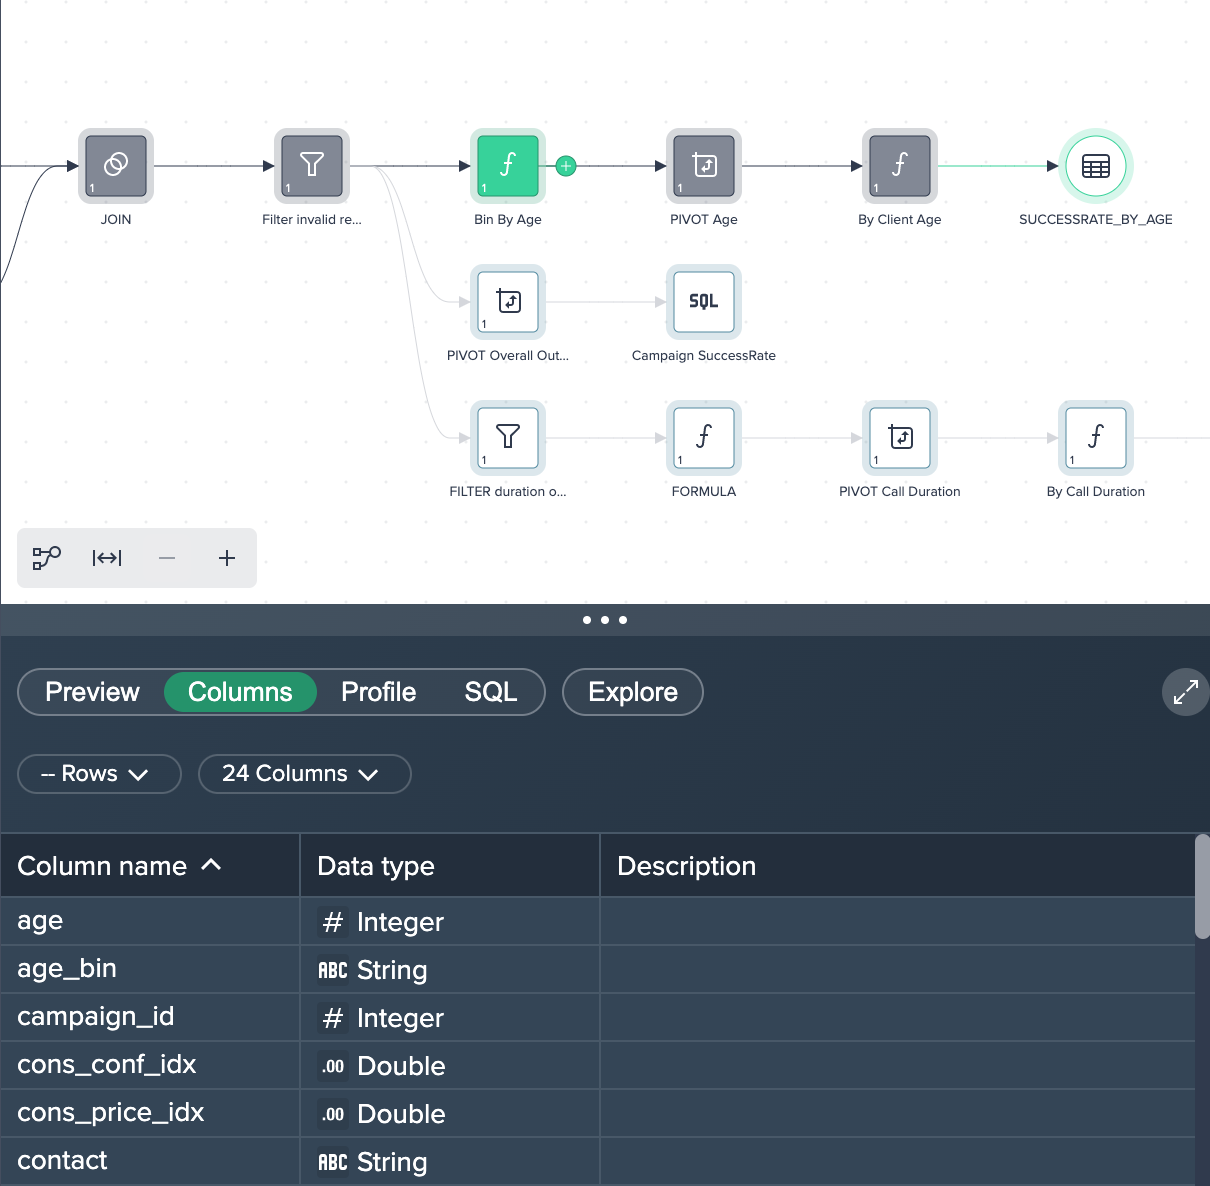
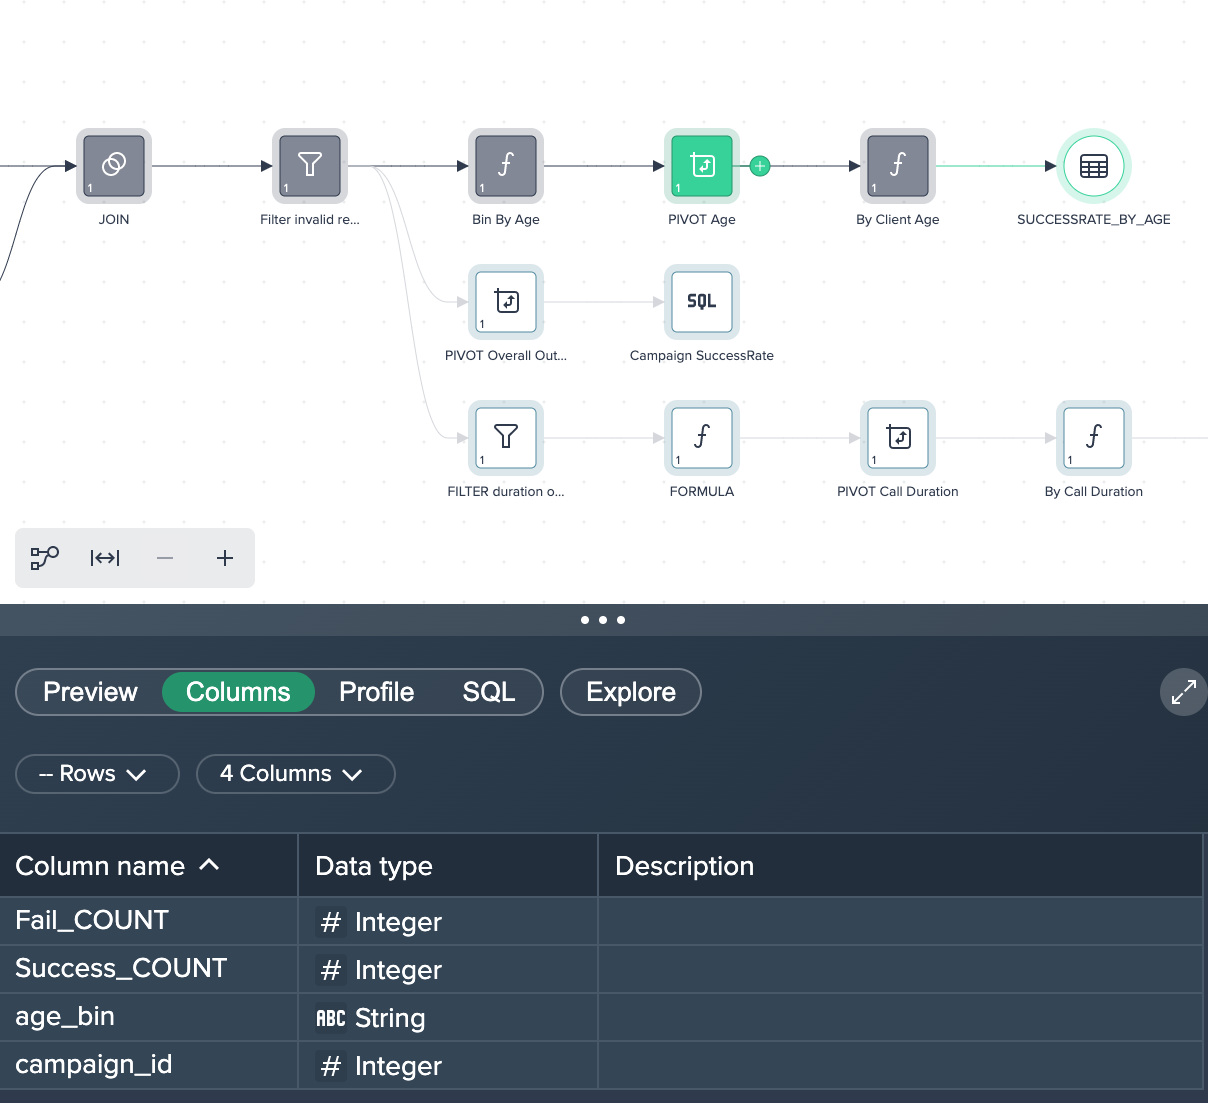
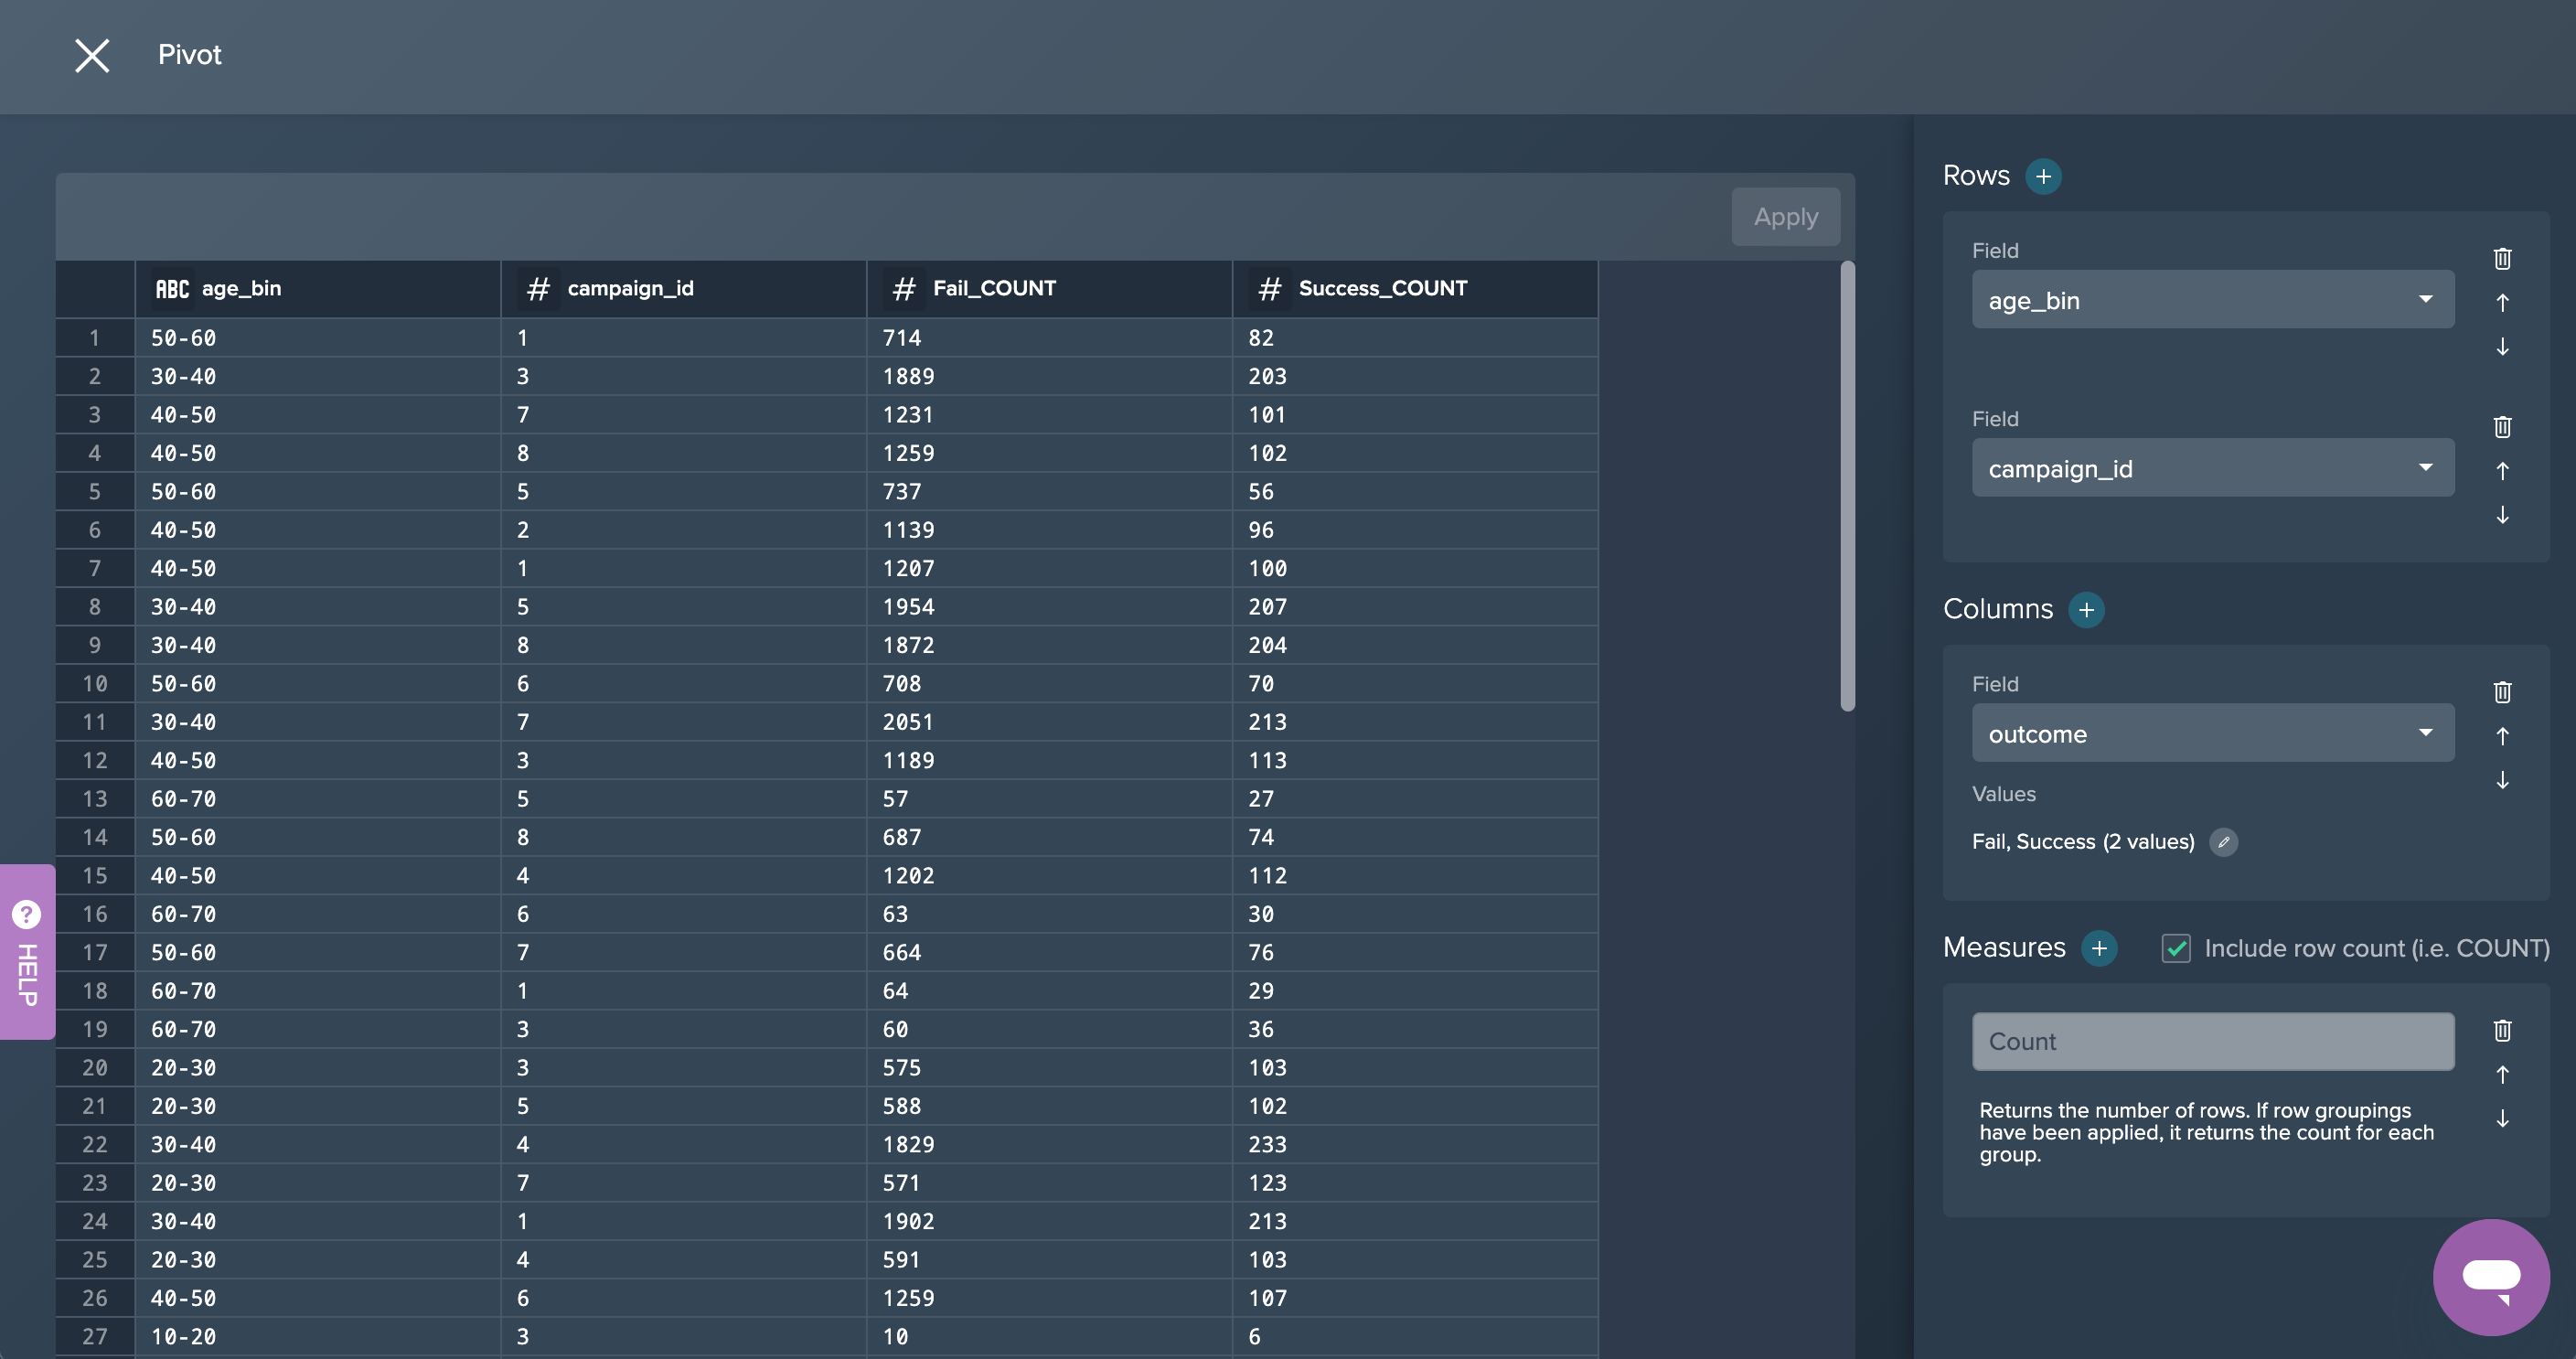
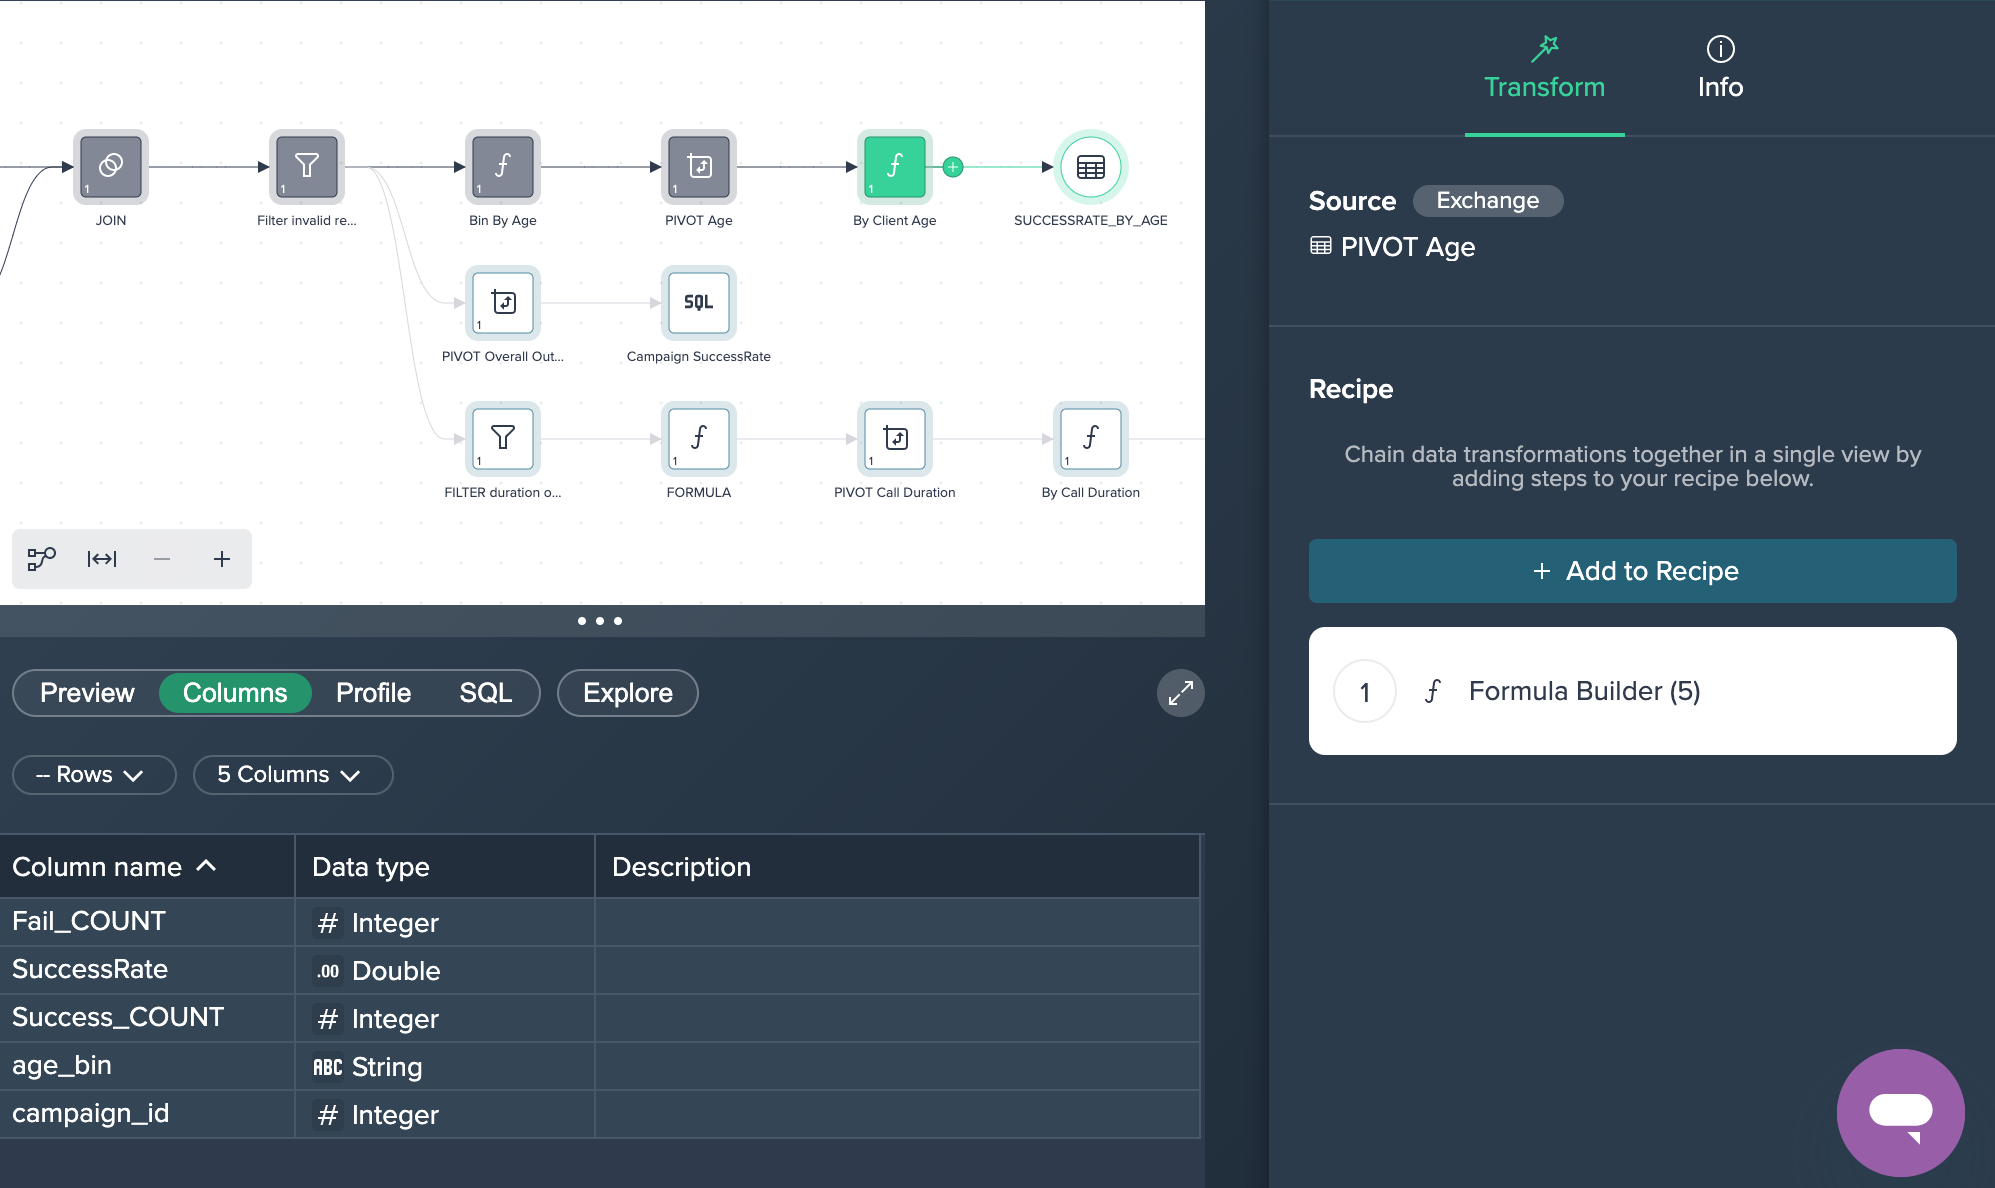
2. PIVOT Age: The columns have been pivoted by 'age_bin' and 'campaign_id' with the measure 'Count'. This was done by applying the no-code operation 'PIVOT' in the Flow Area.
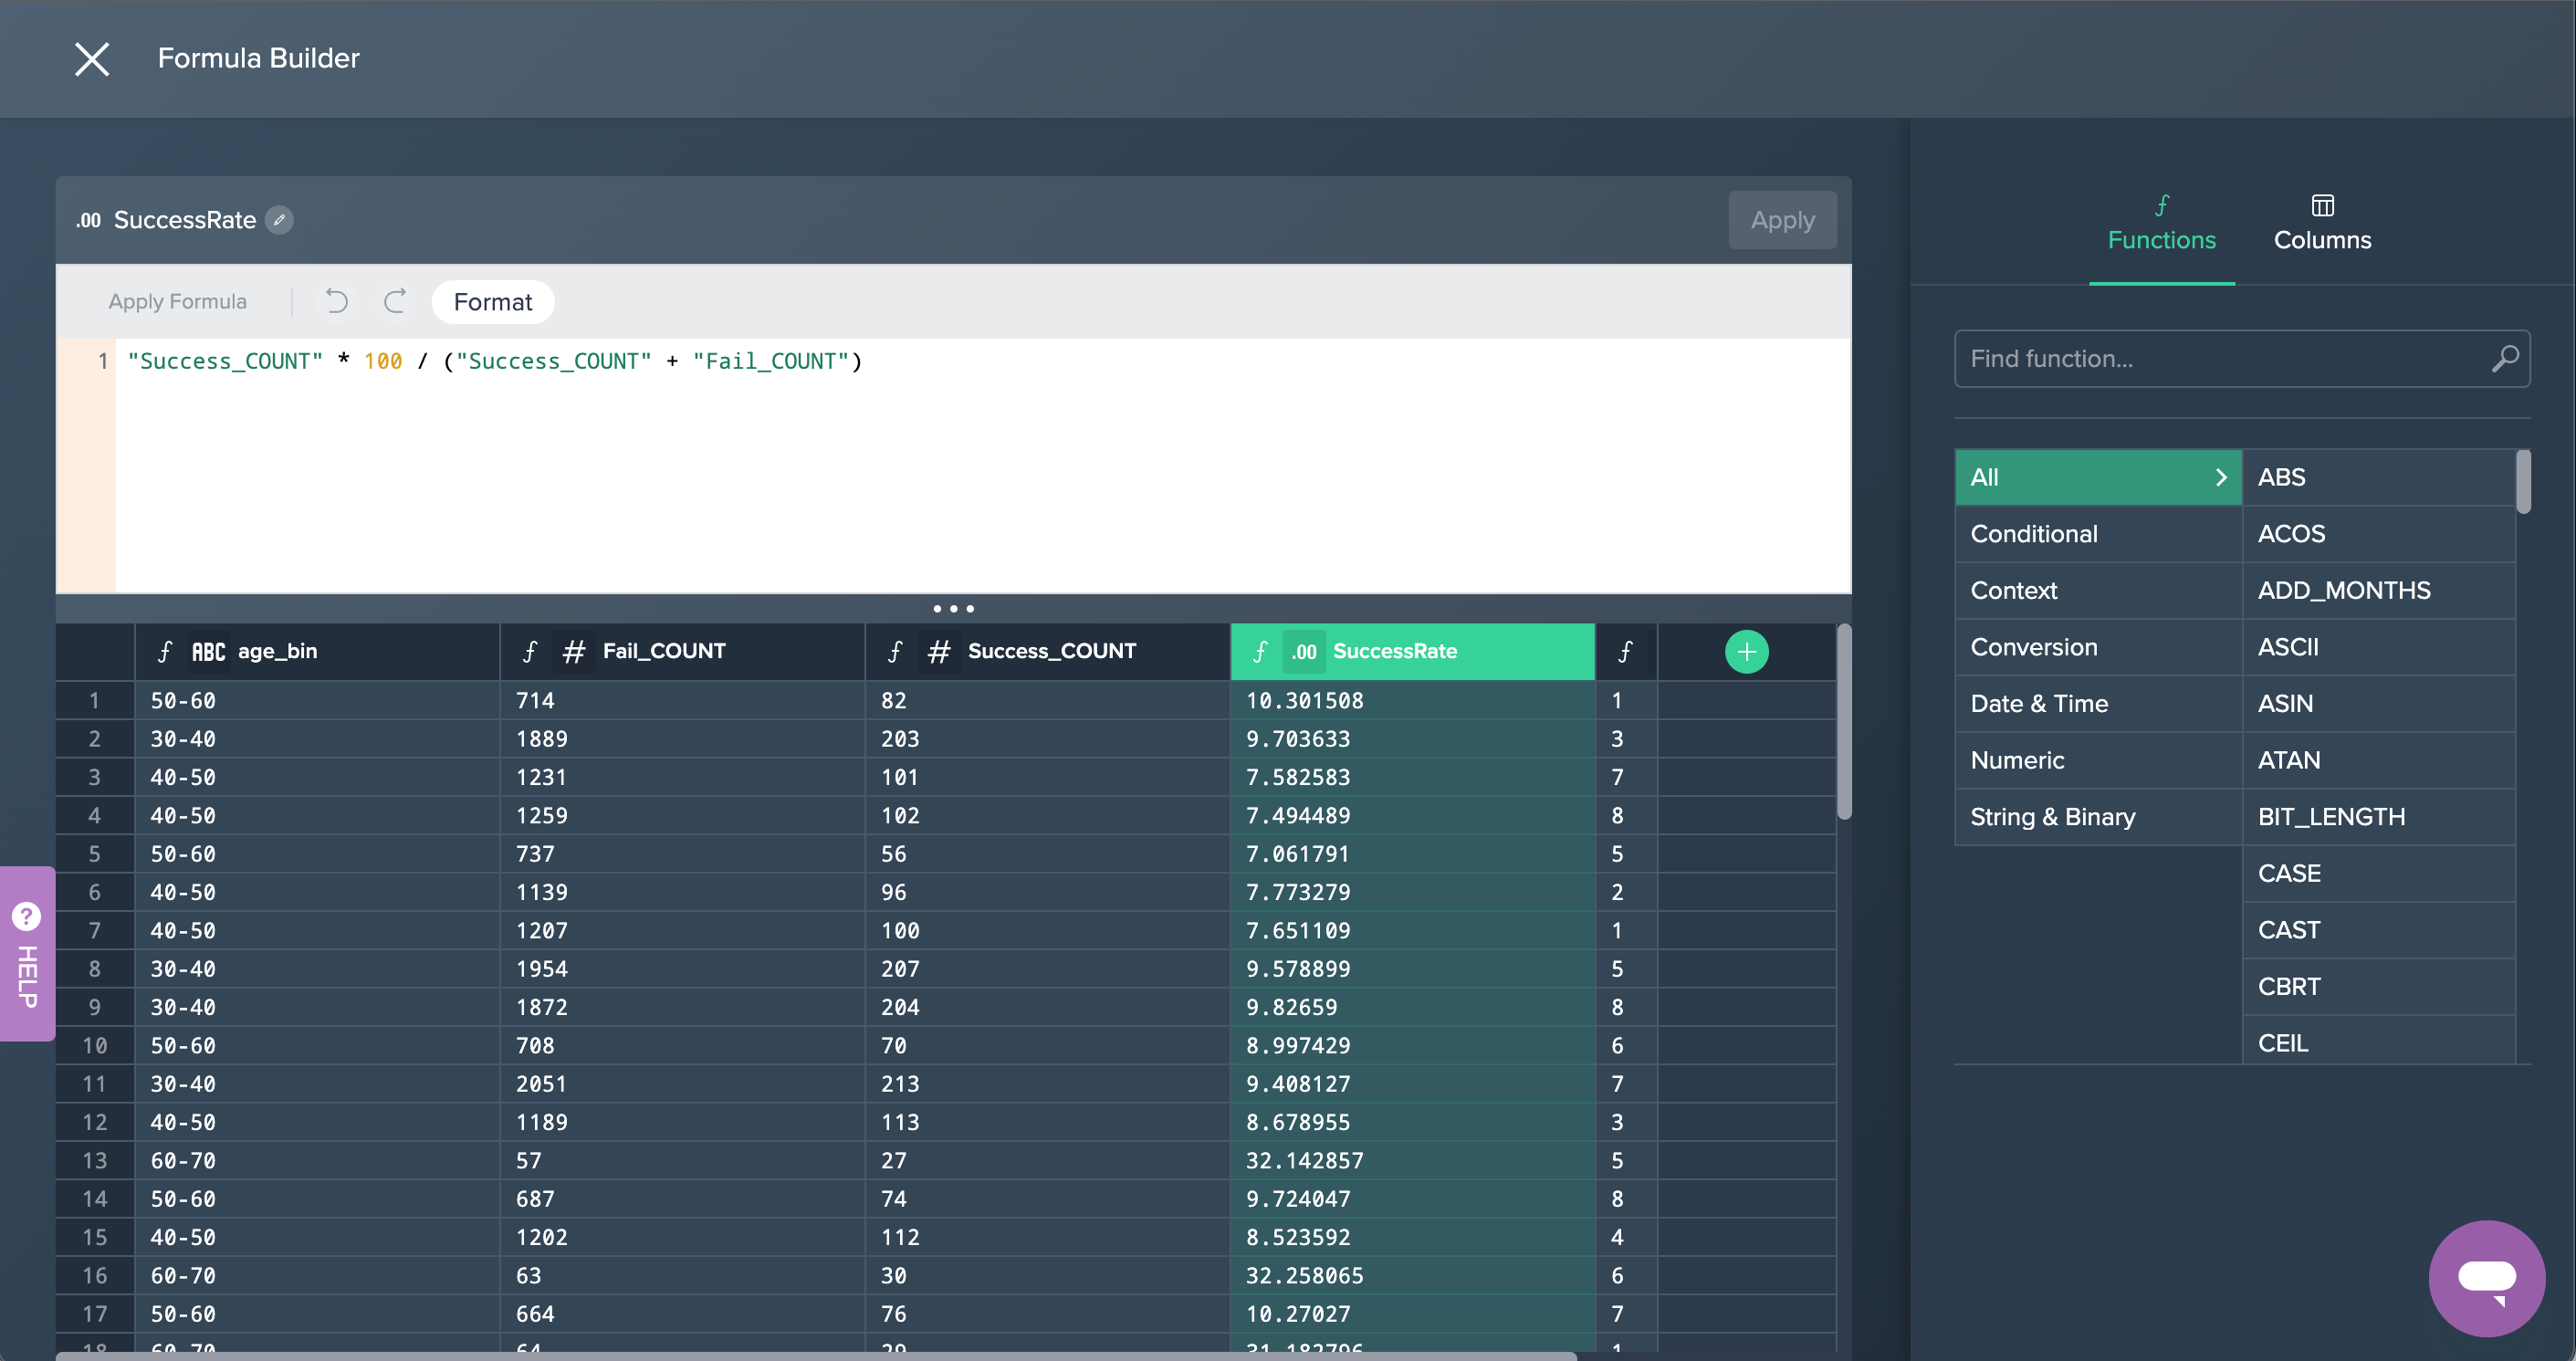
3. By Client Age: Finally, the column 'Success Rate' has been created in the Formula Editor in order to calculate the success rate of the calls. This partial goal was now successfully achieved.
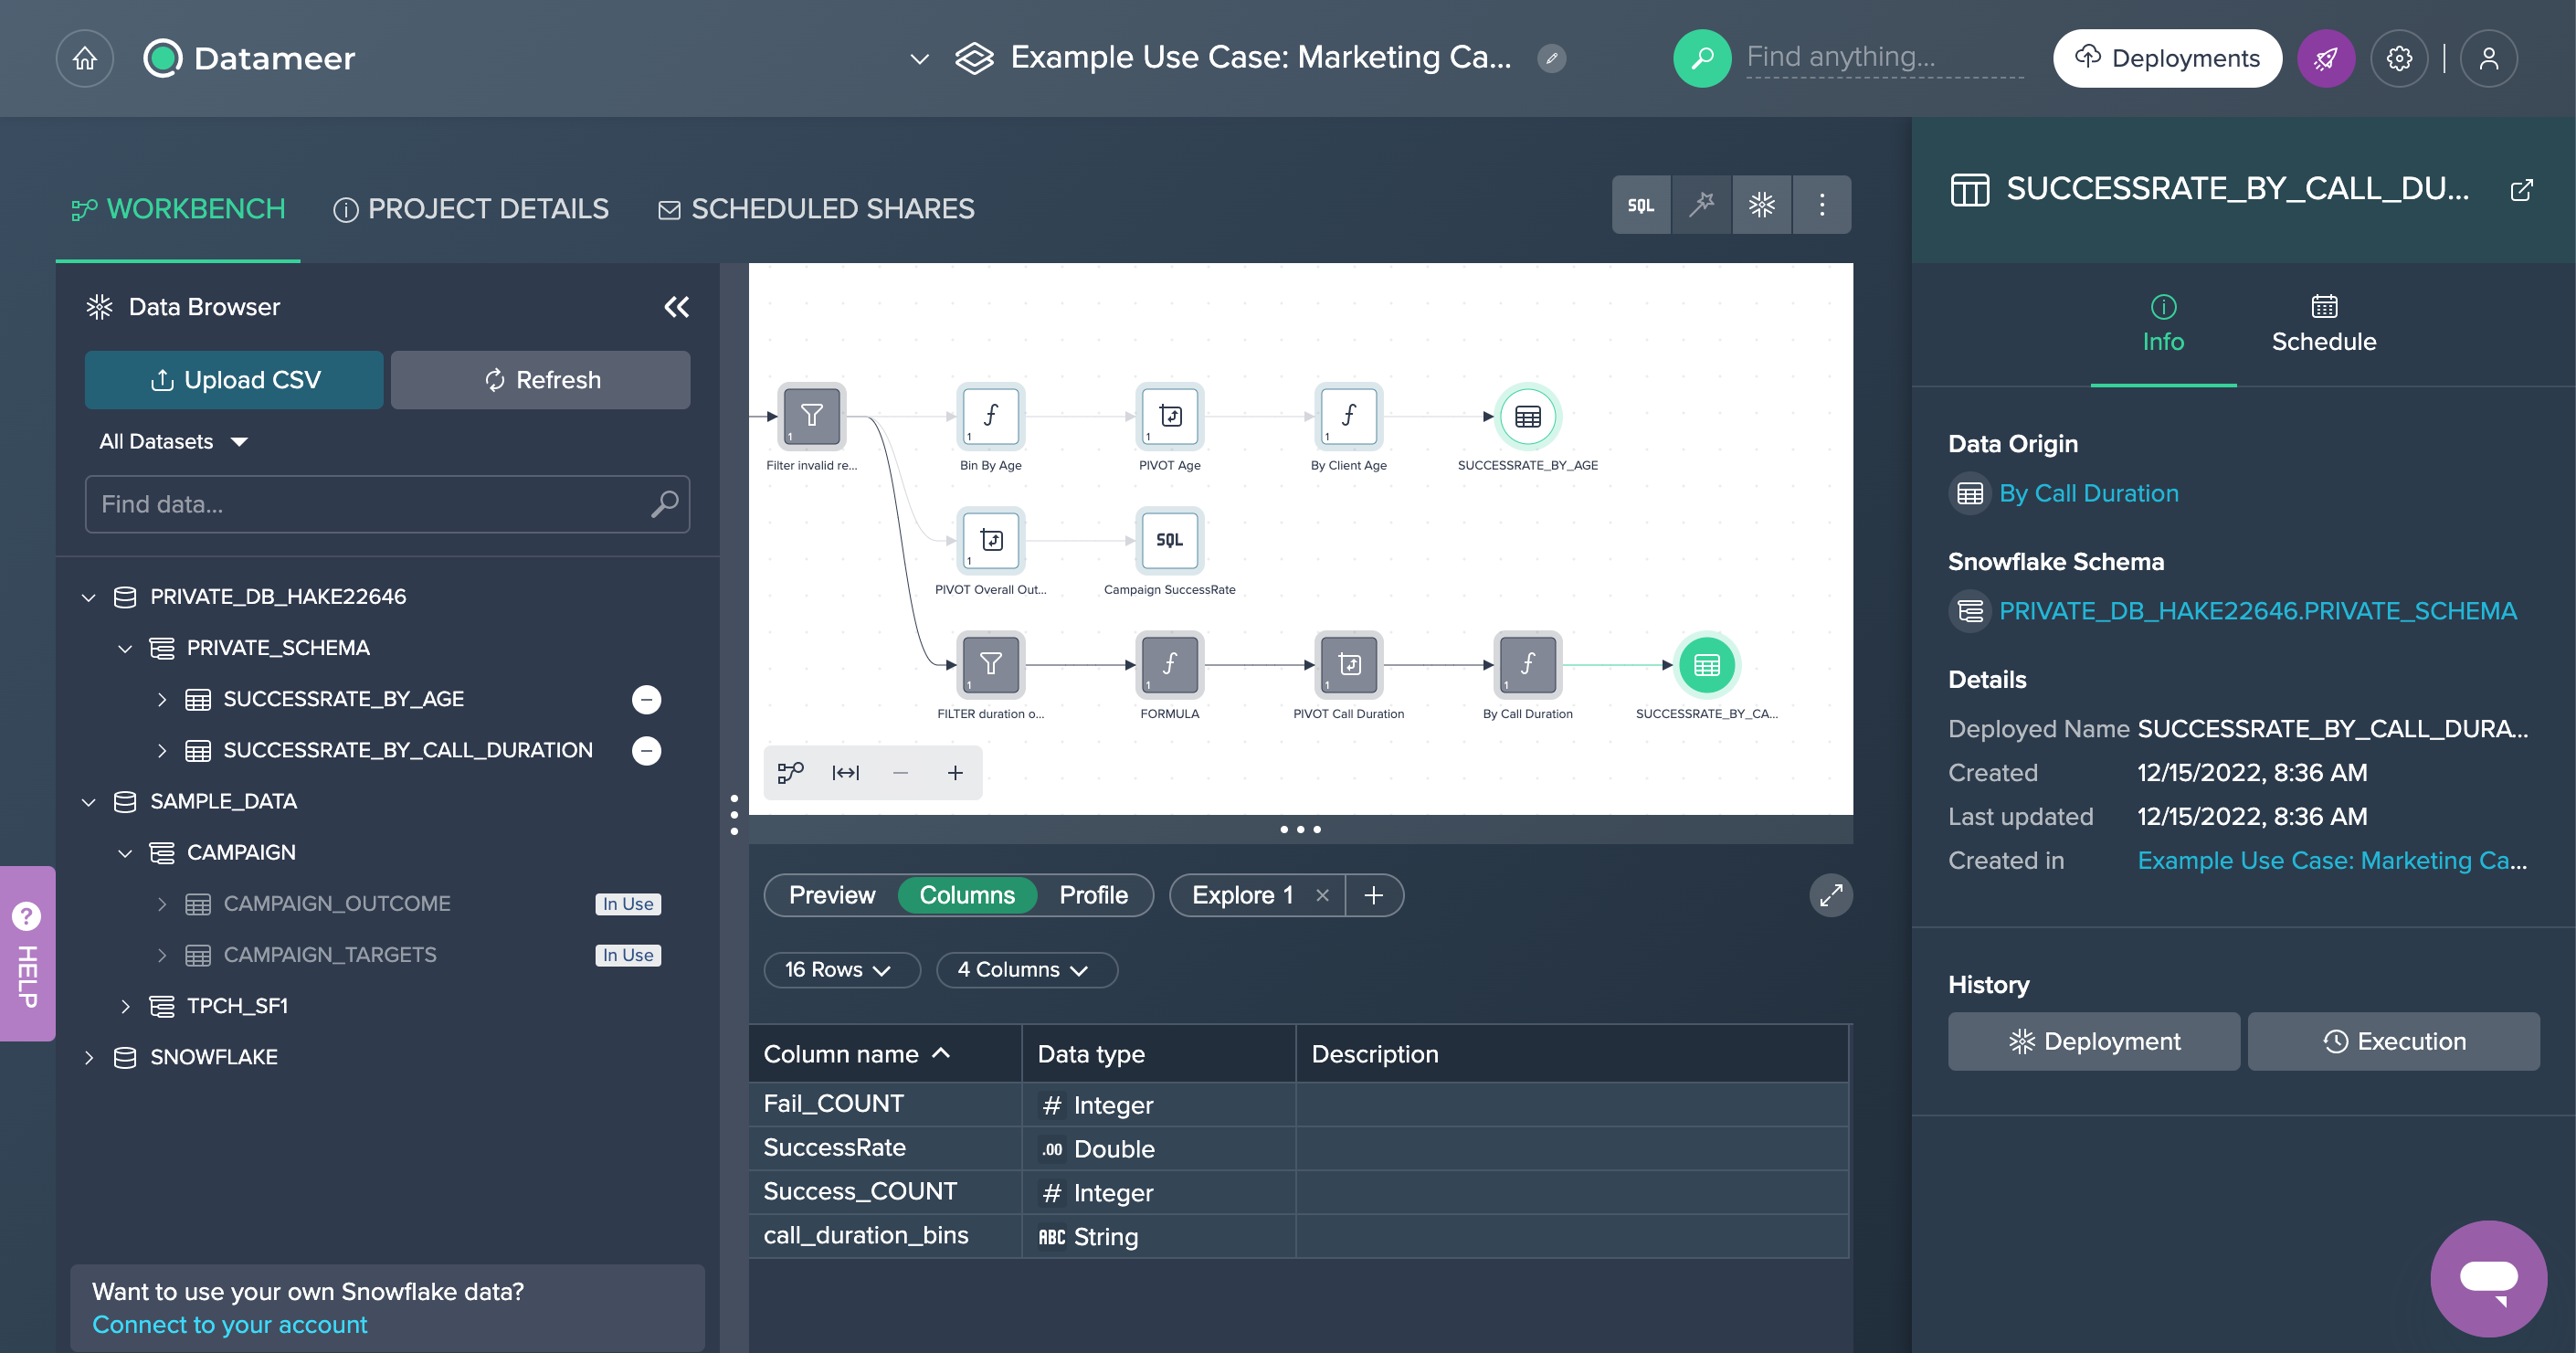
Success Rate by Call Length#
The second goal is to achieve the success rate by call duration.
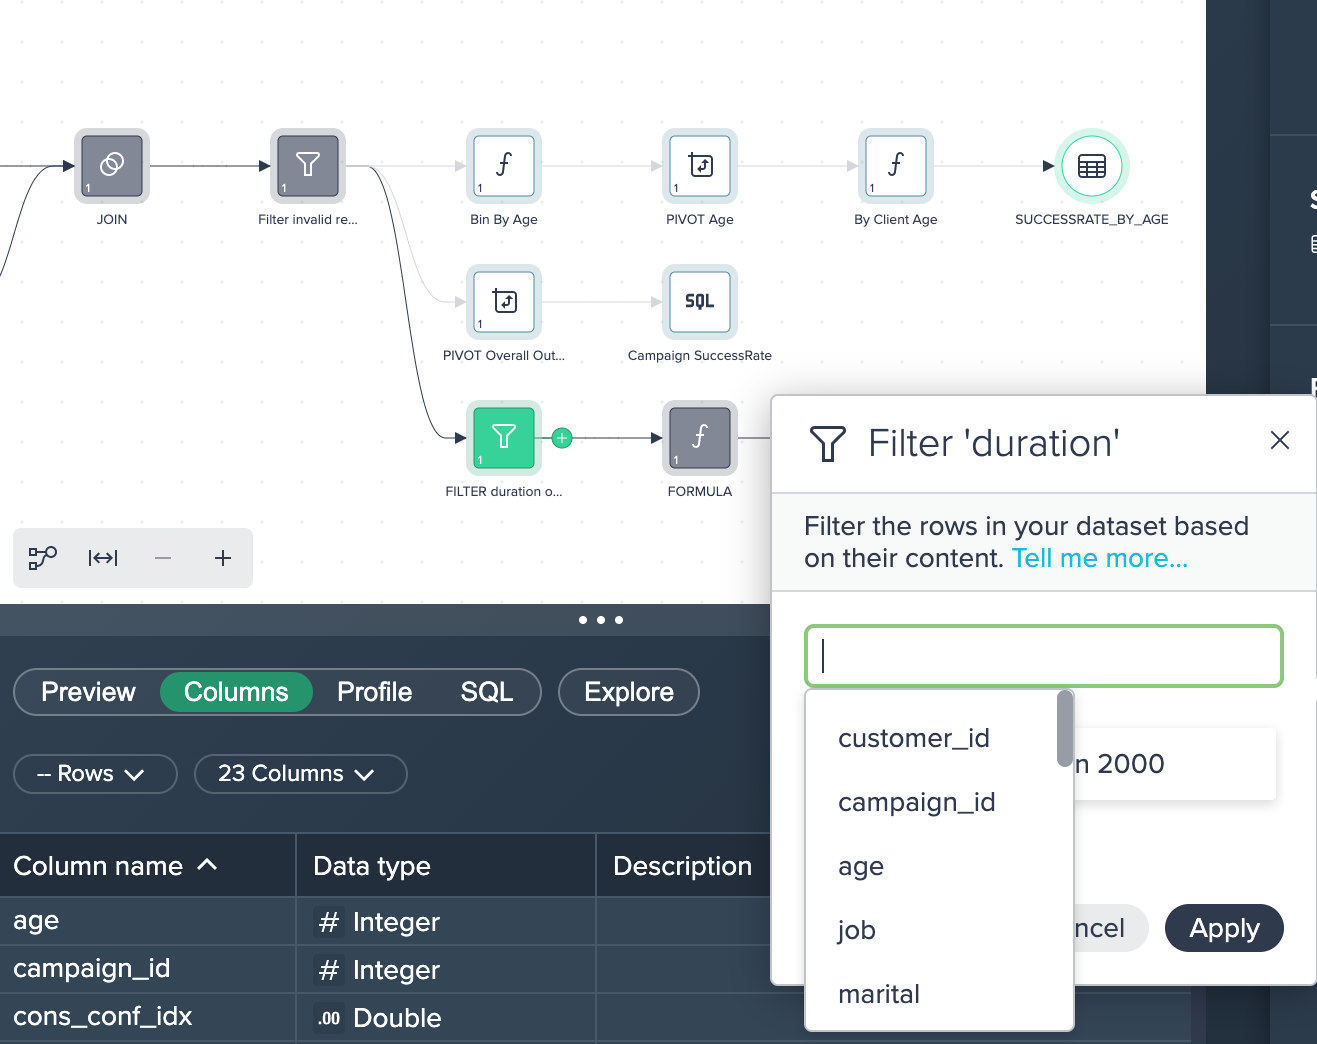
1. FILTER duration outlier: The data has been filtered for a duration that was less than 2000 seconds. This was done by applying the no-code operation 'FILTER'.

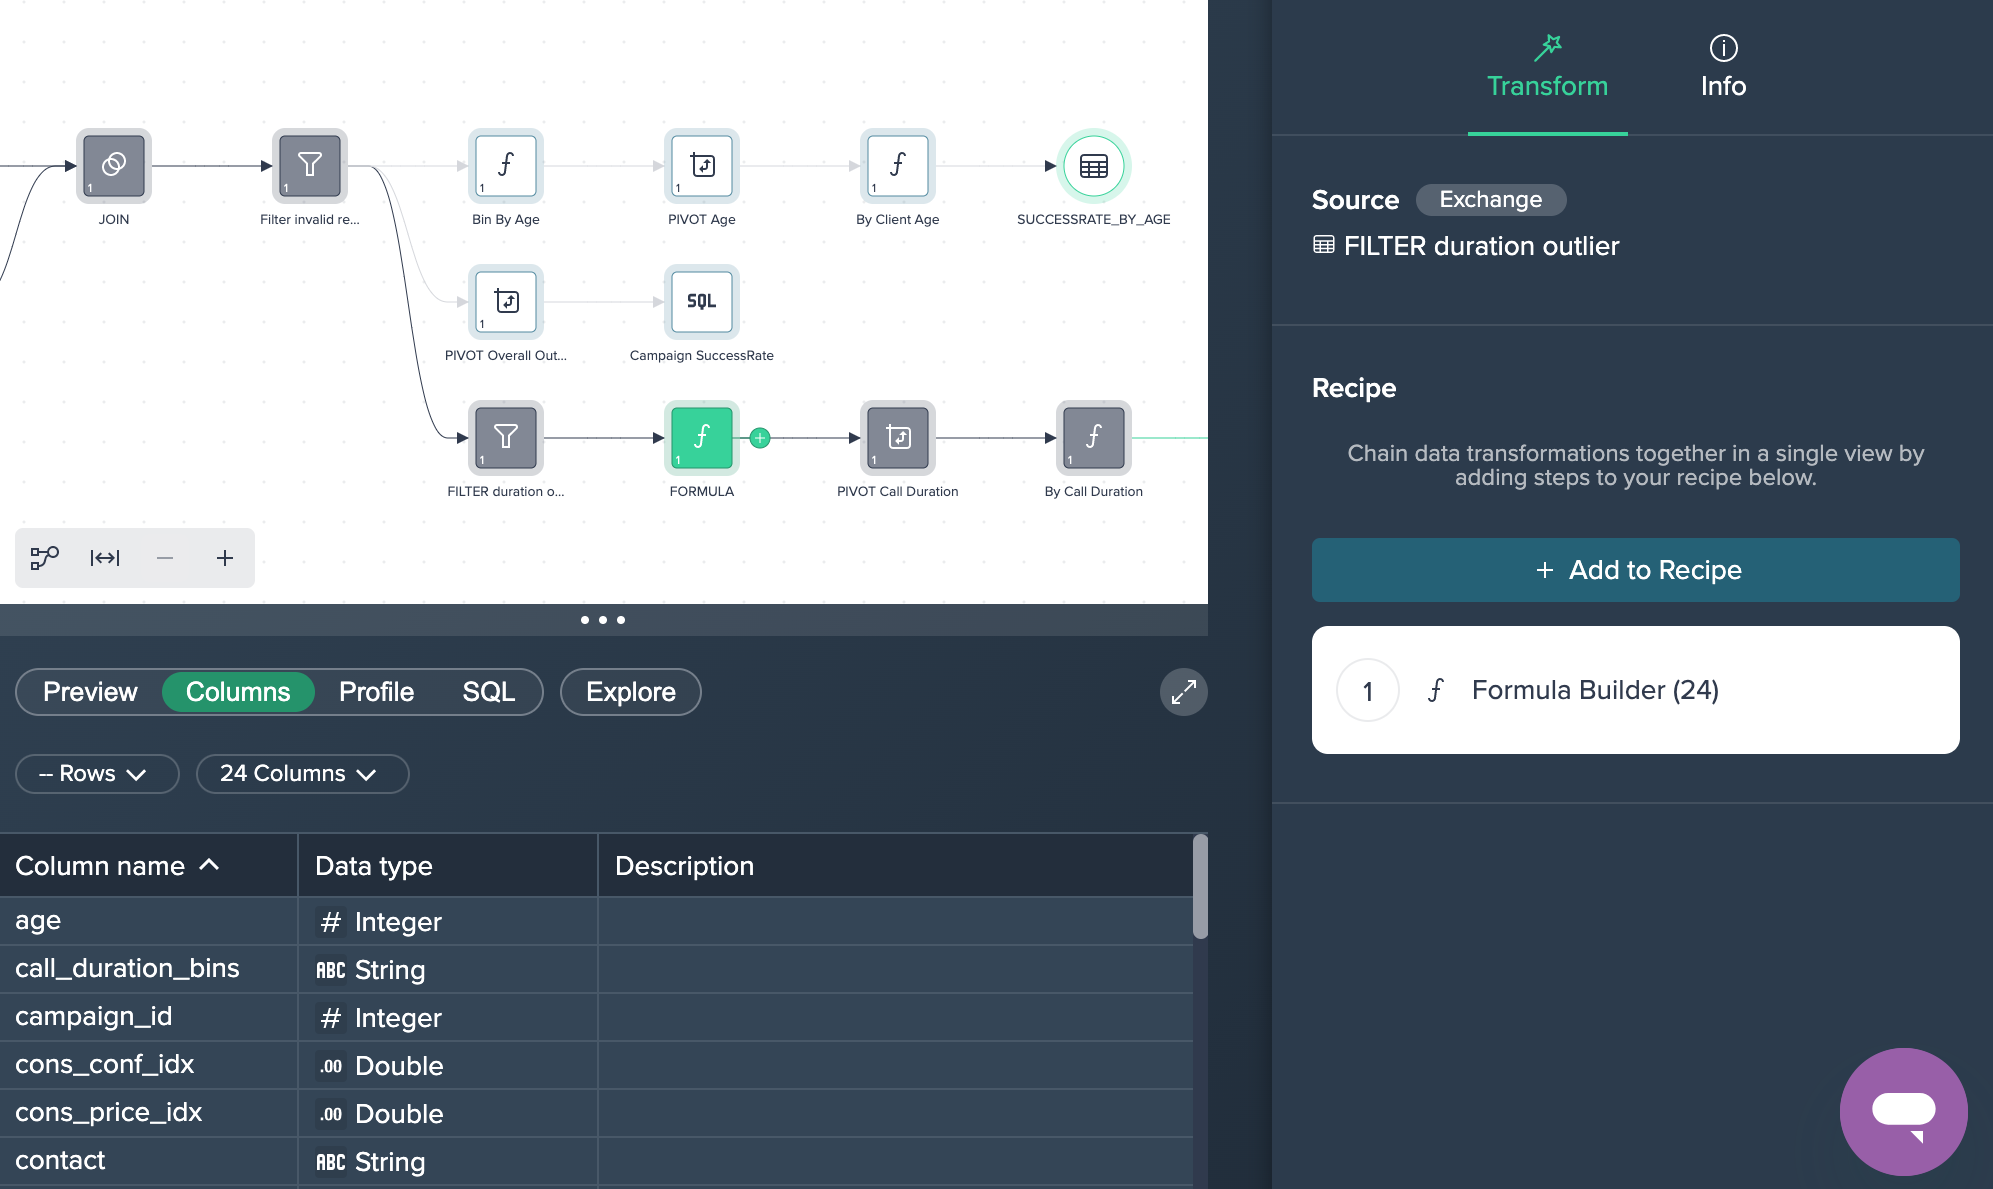
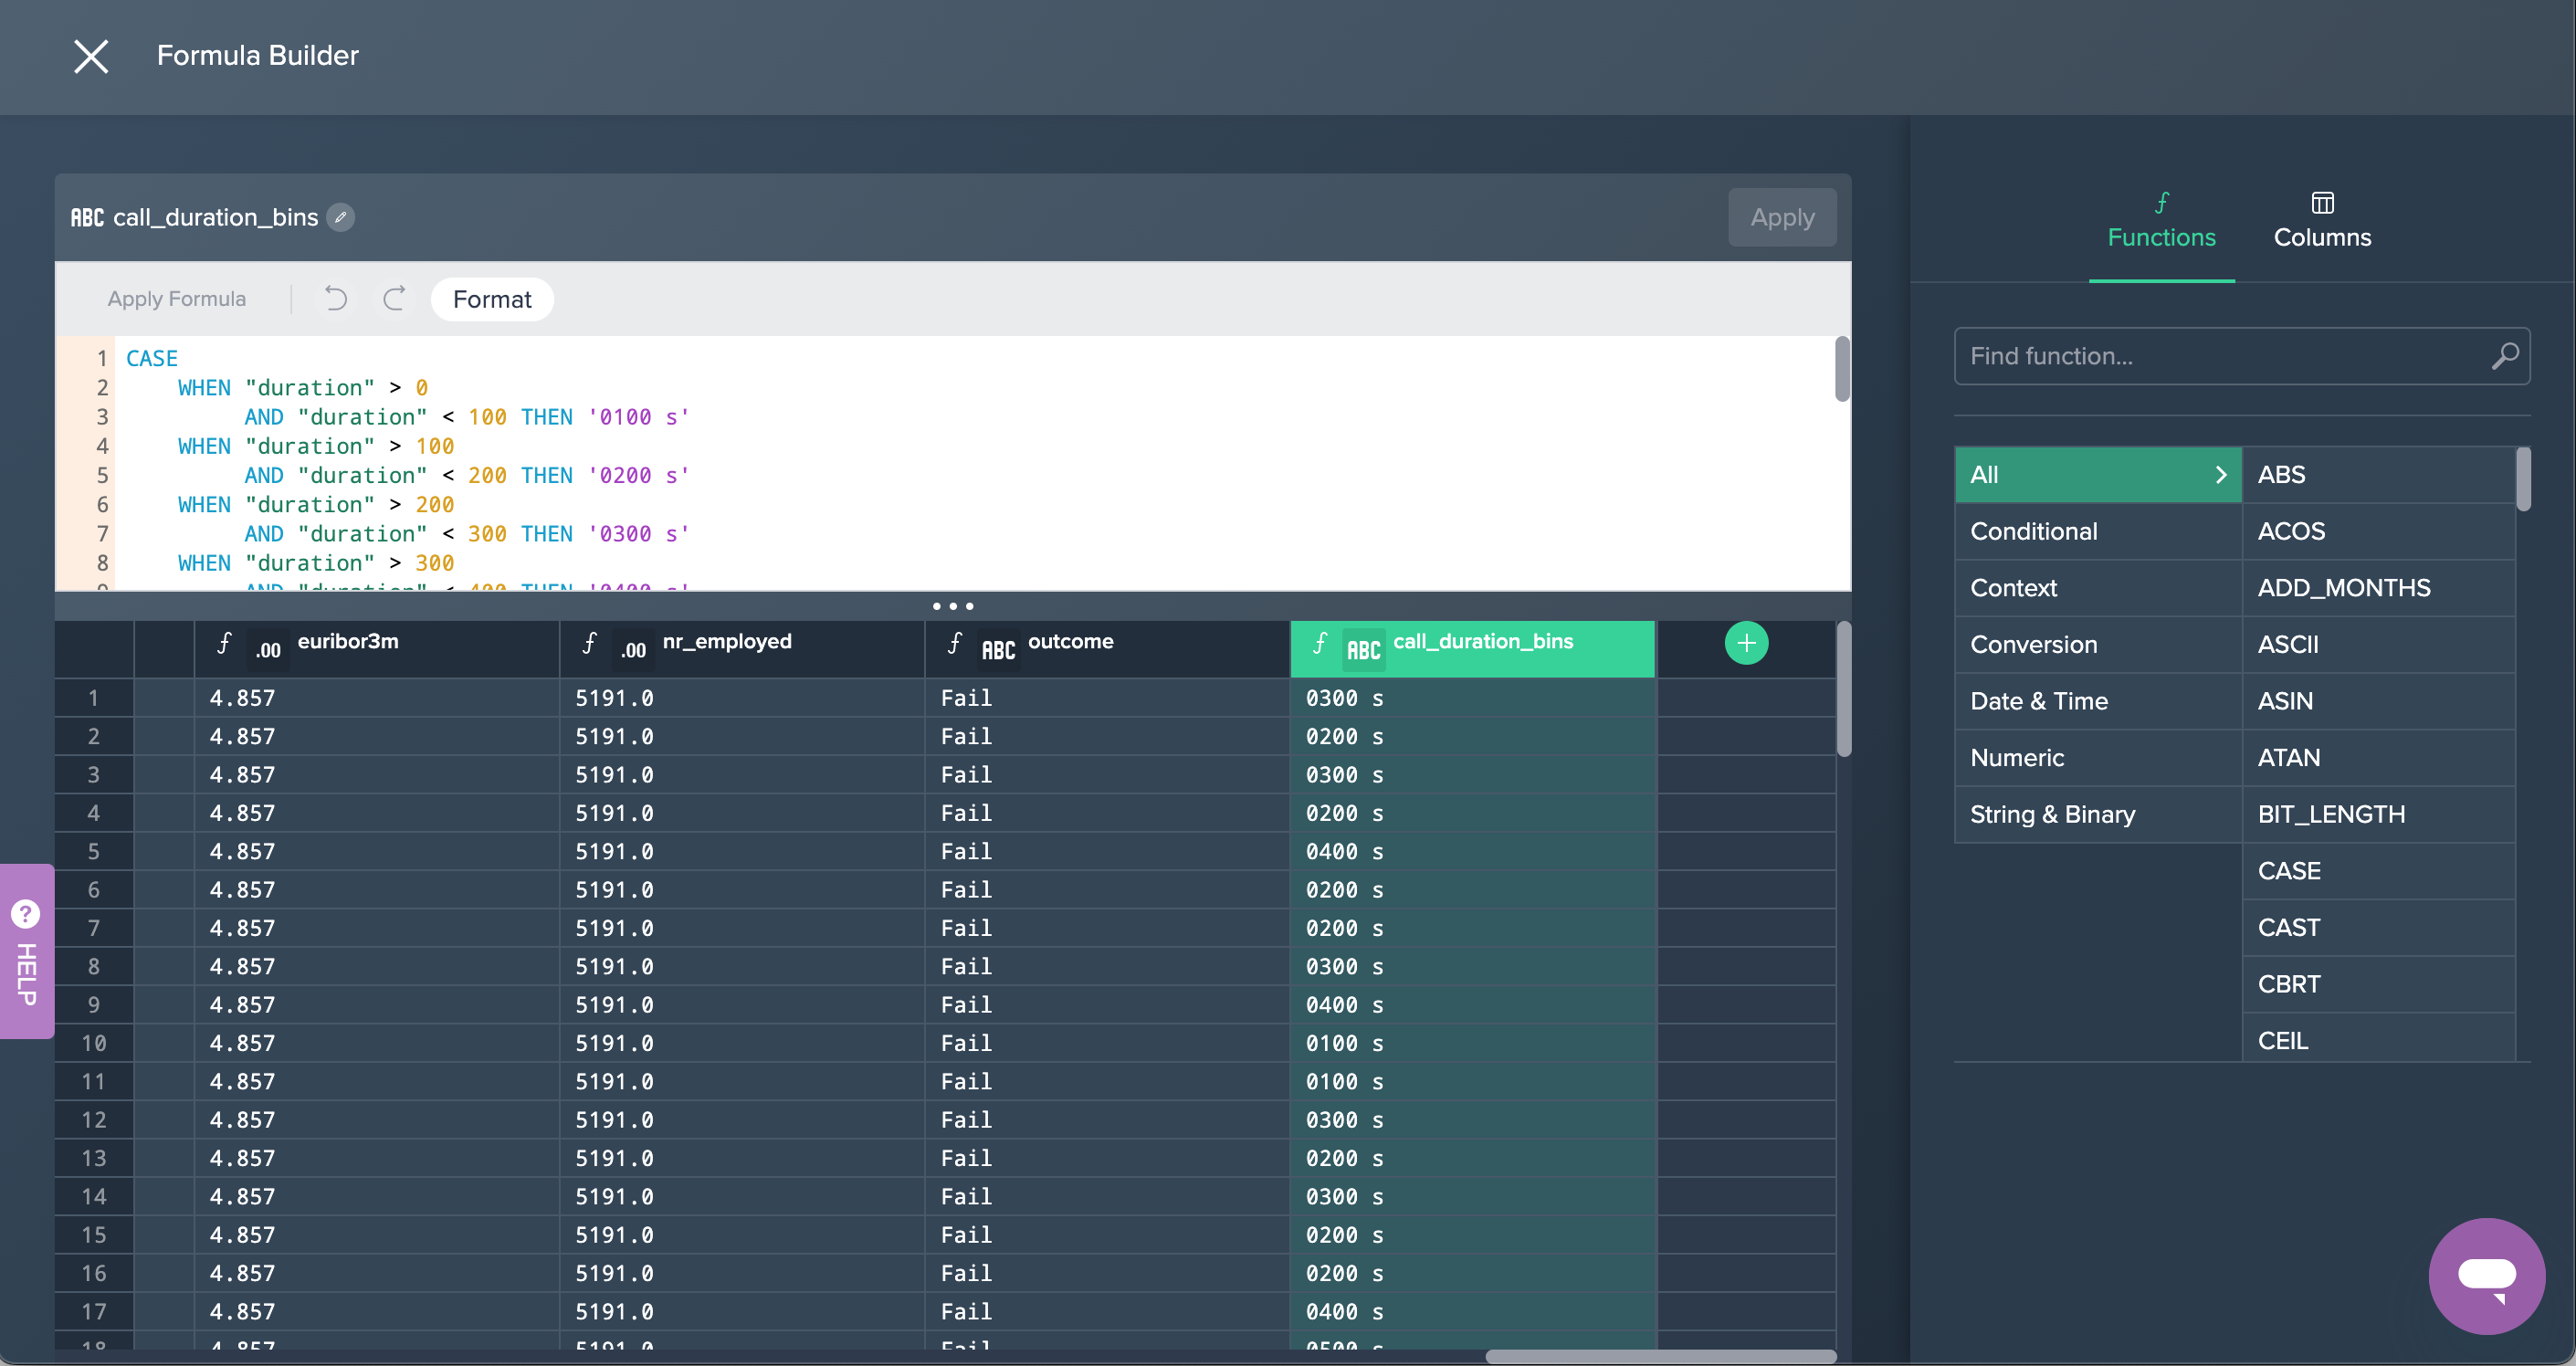
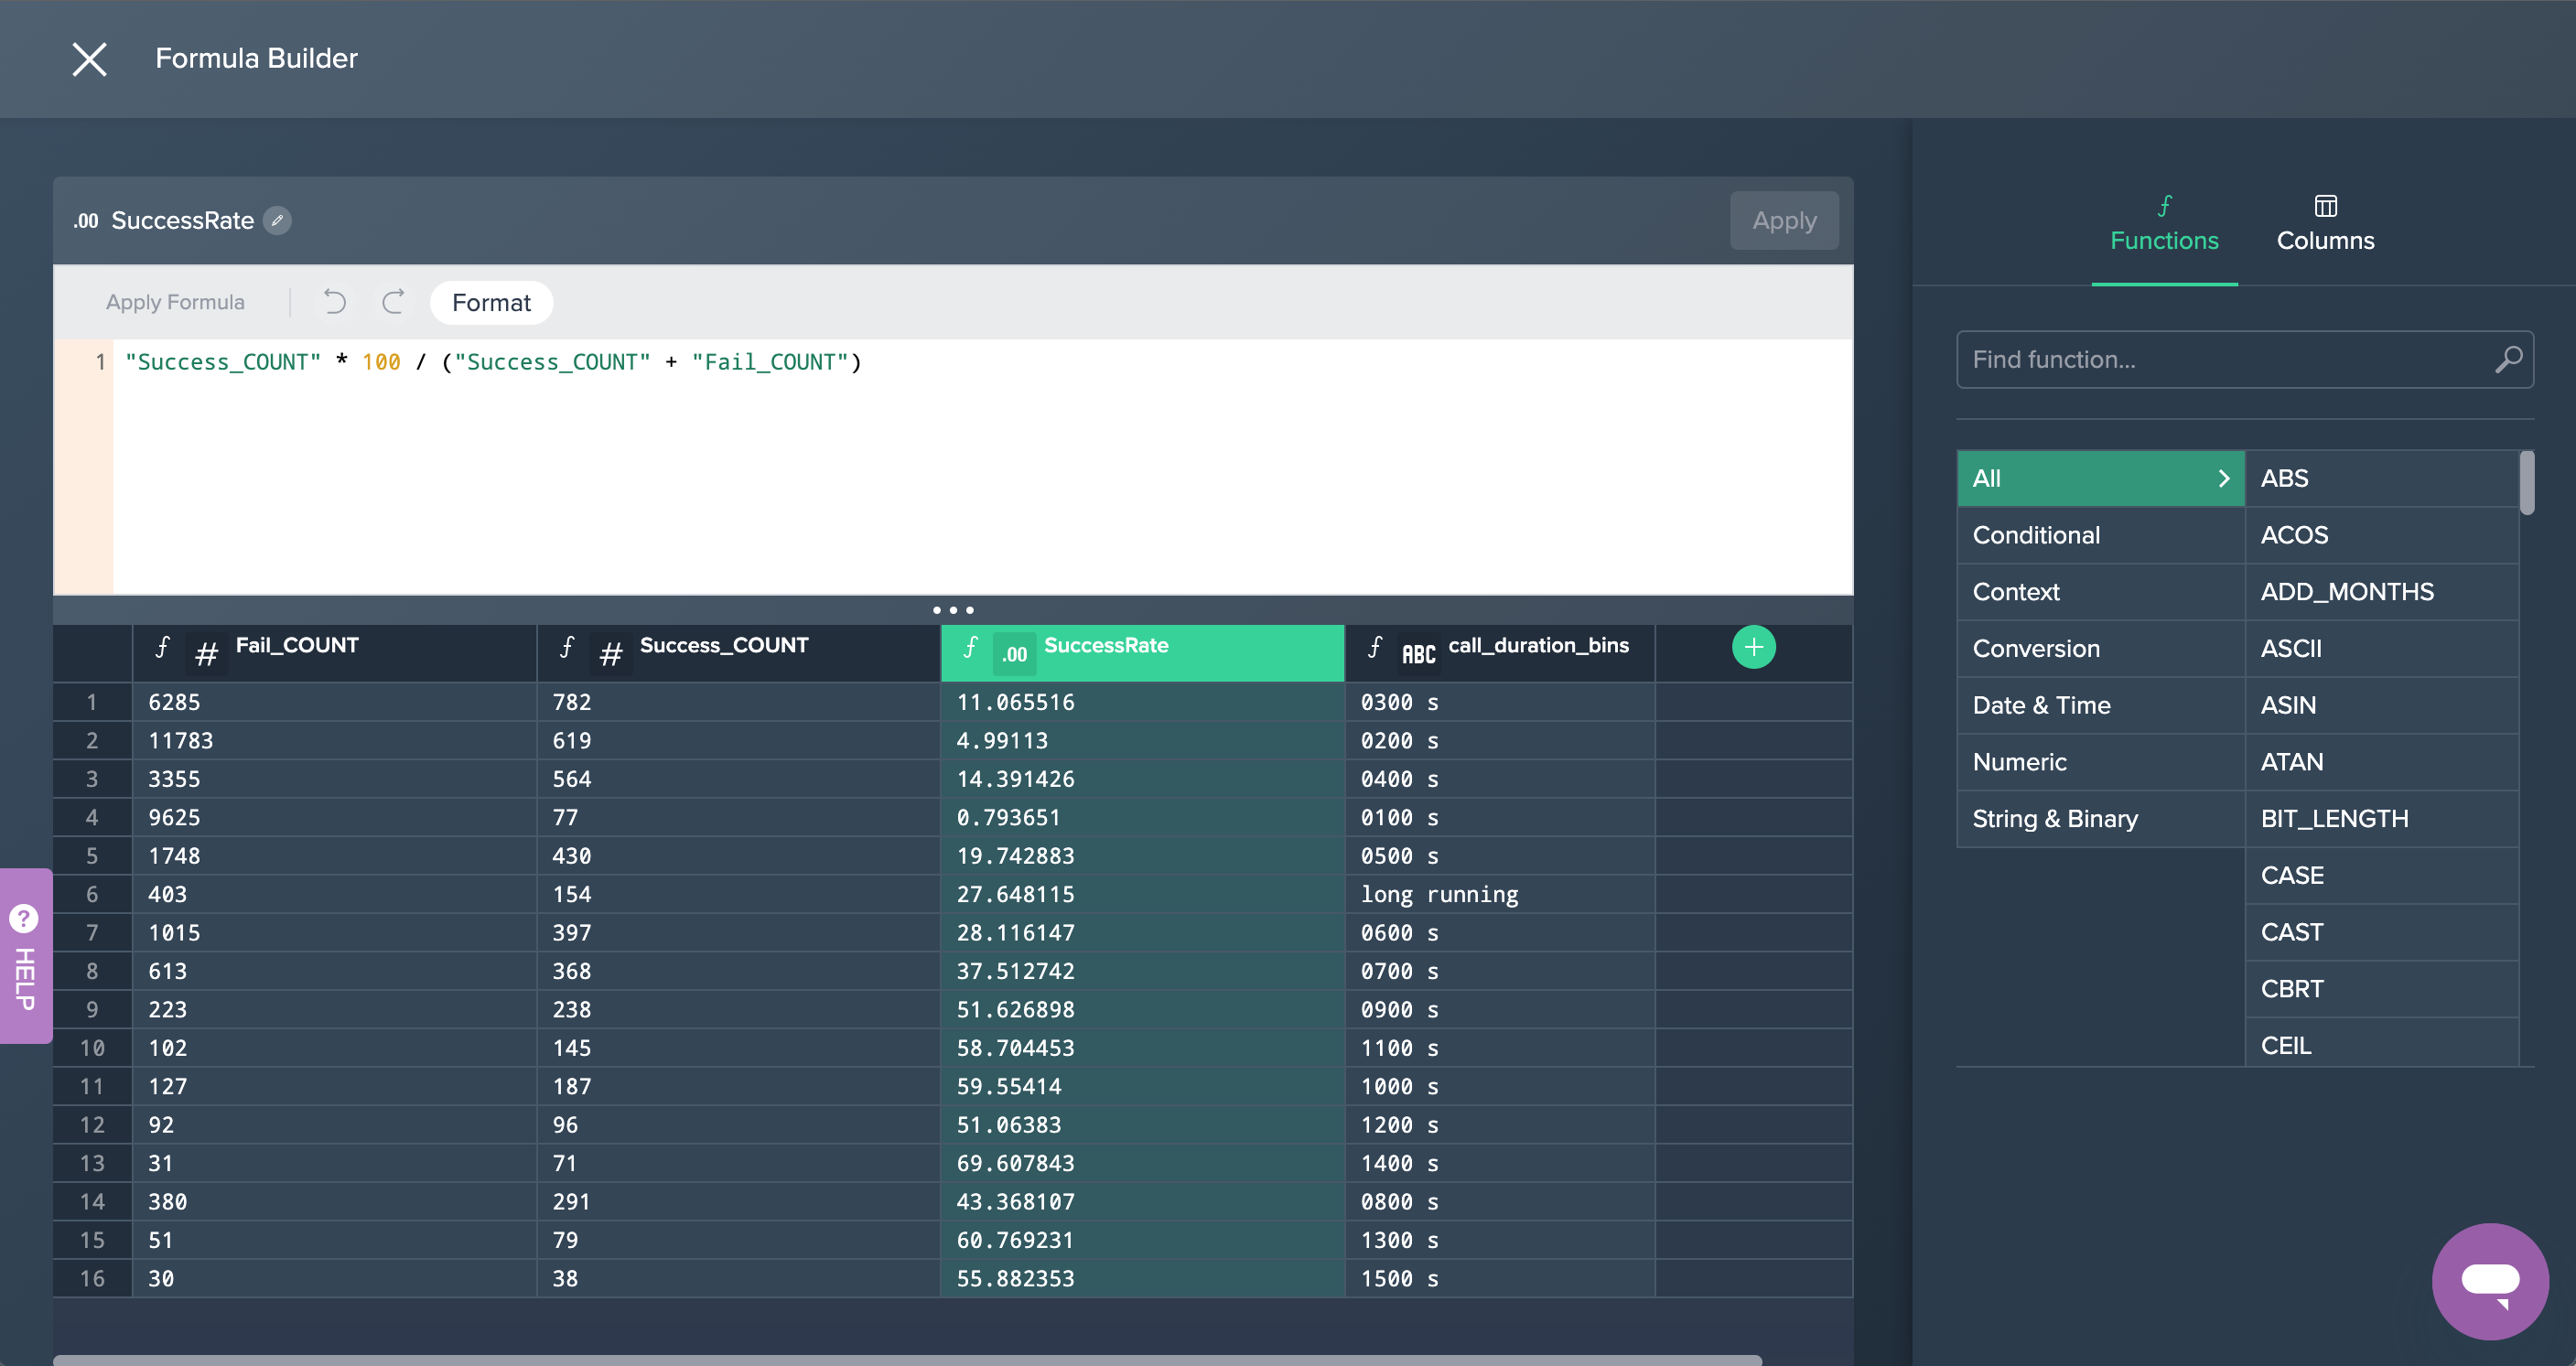
2. FORMULA: Next, the column 'call_duration_bins' has been added in the Formula Editor in order to create values rounded up or down to 100-second segments each.
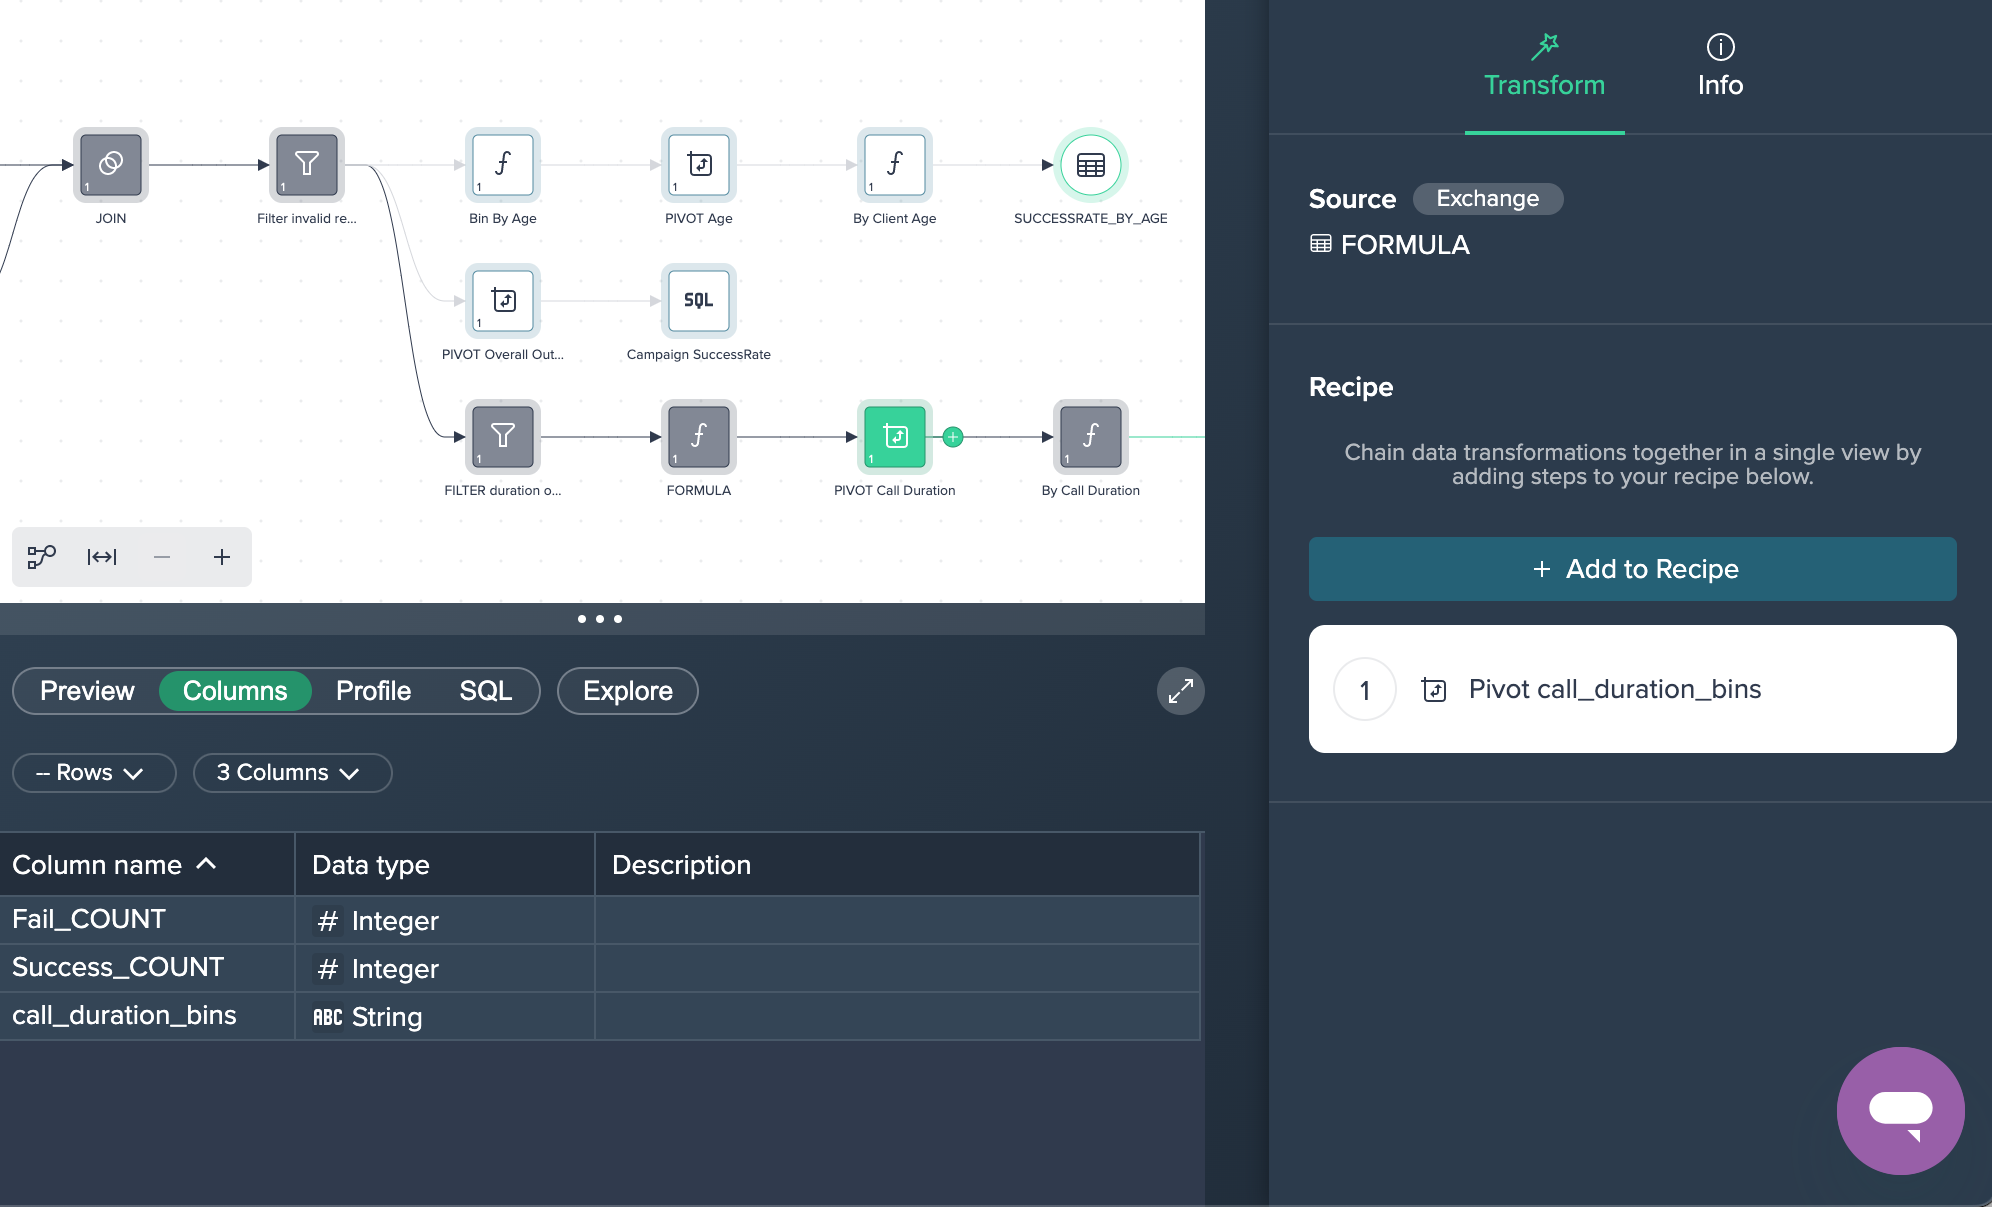
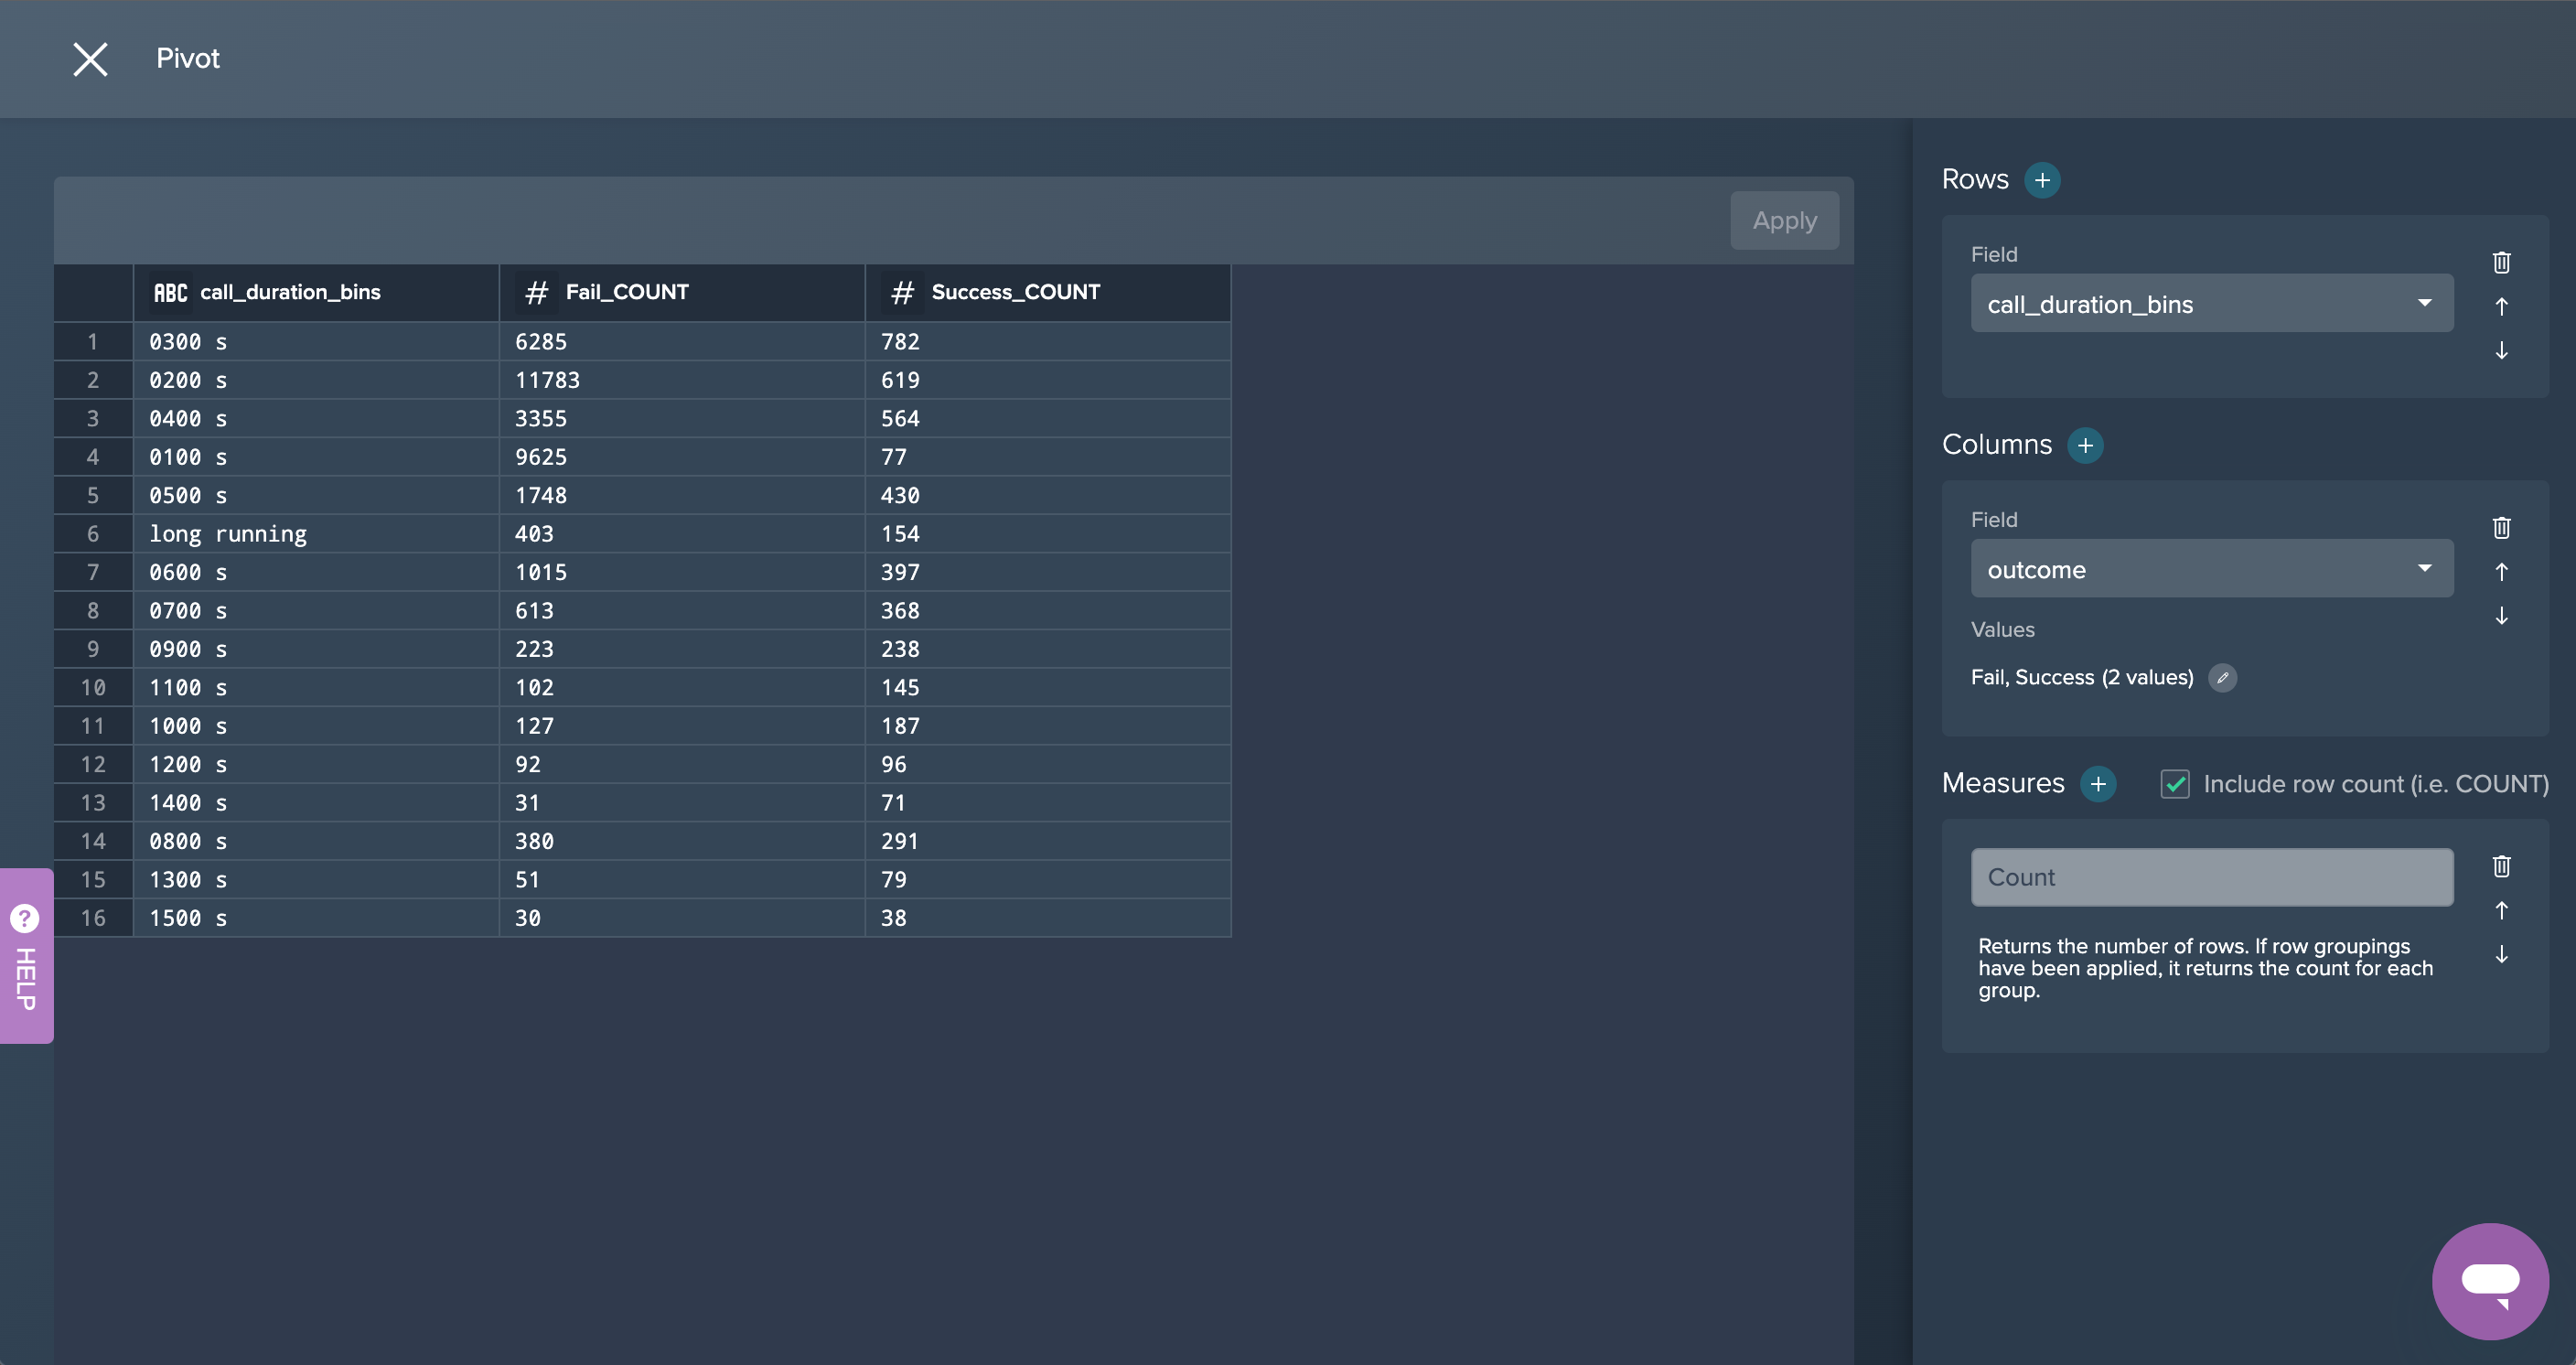
3. PIVOT Call Duration: The intermediate data set are now pivoted by 'call_duration_bins' to measure the fail and success counts. This was done by applying the no-code operation 'PIVOT' in the Flow Area.
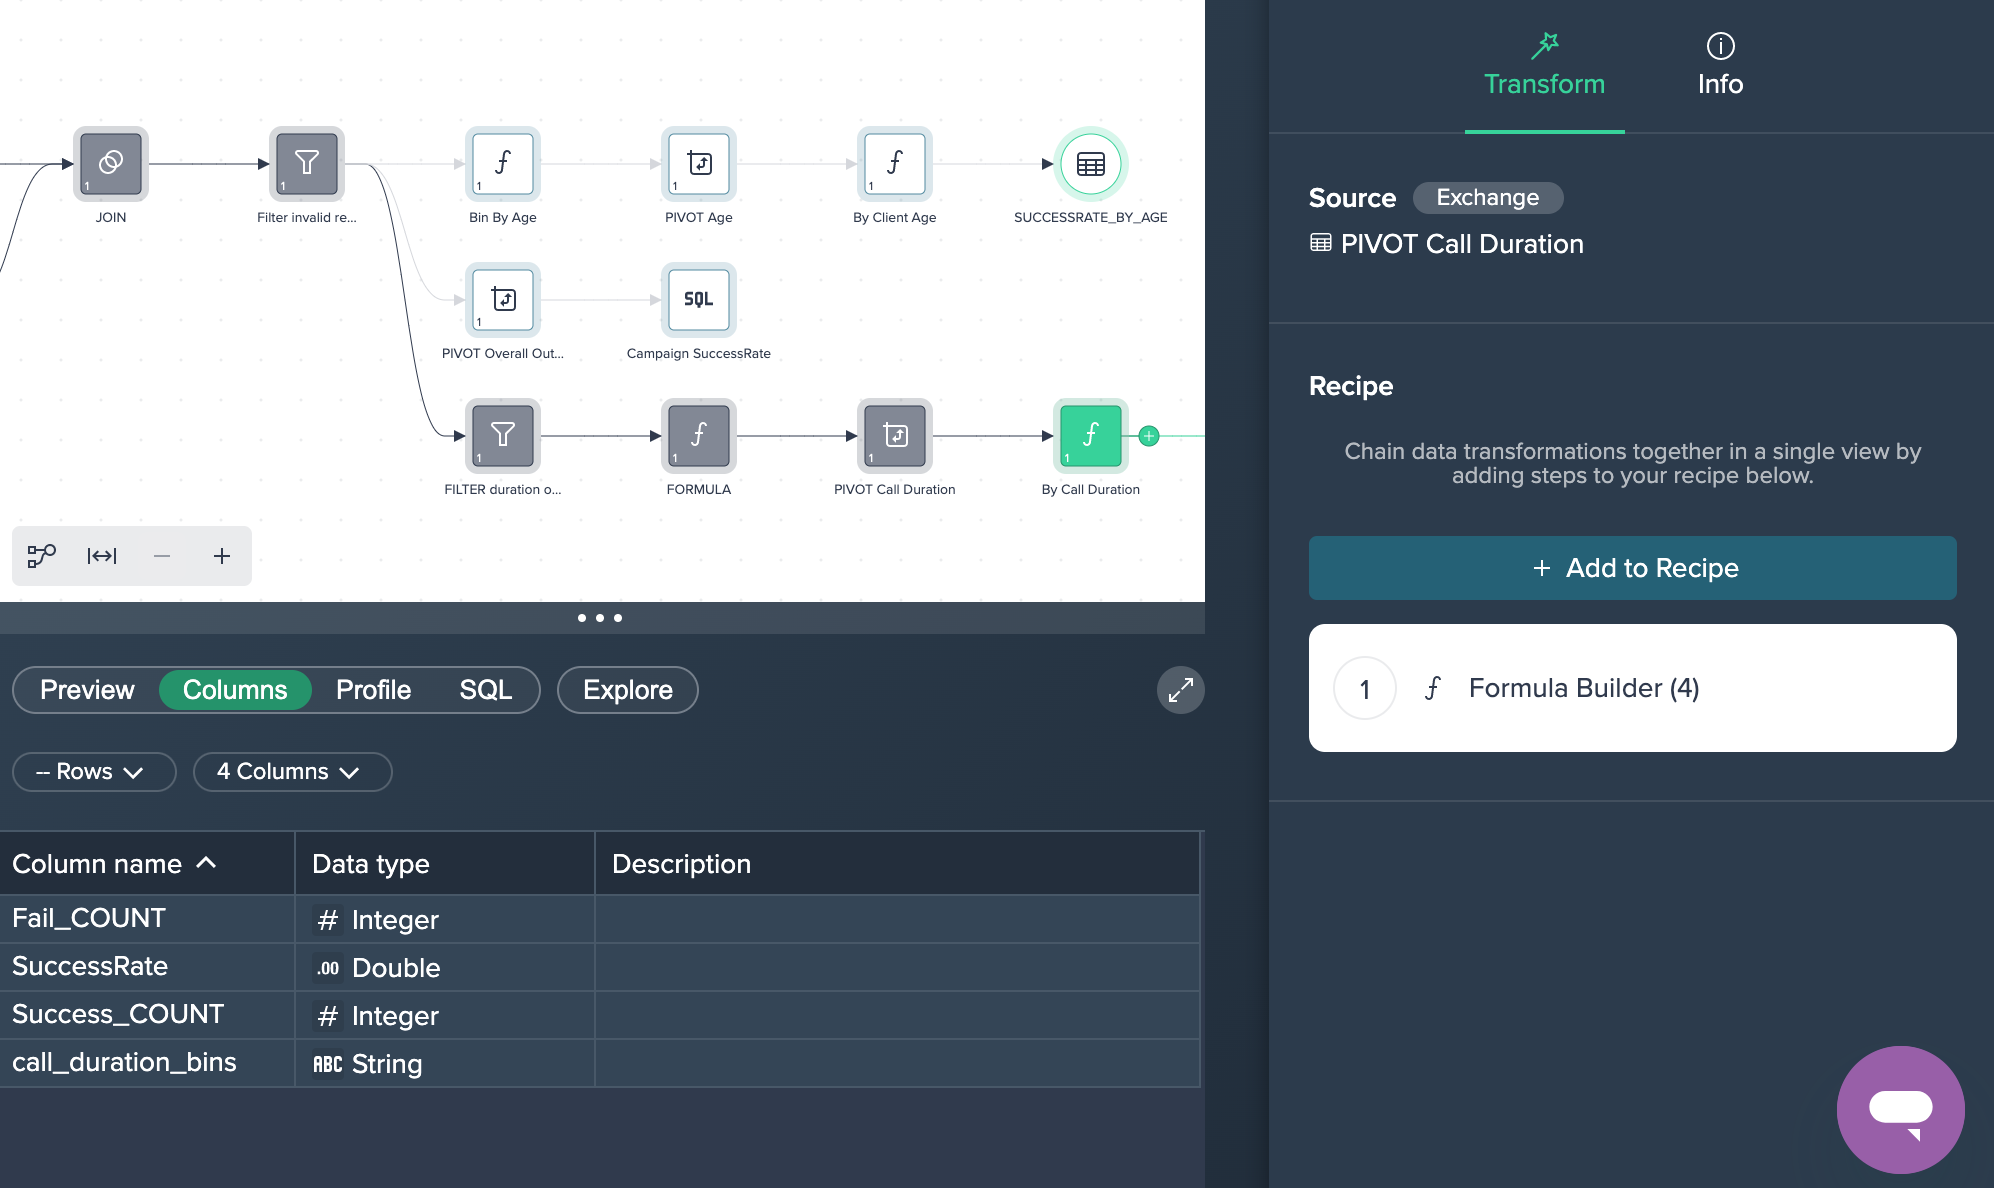
4. By Call Duration: Finally, the column 'SuccessRate' has been created in the Formula Editor in order to calculate the success rate of the calls. This partial goal was now successfully achieved.
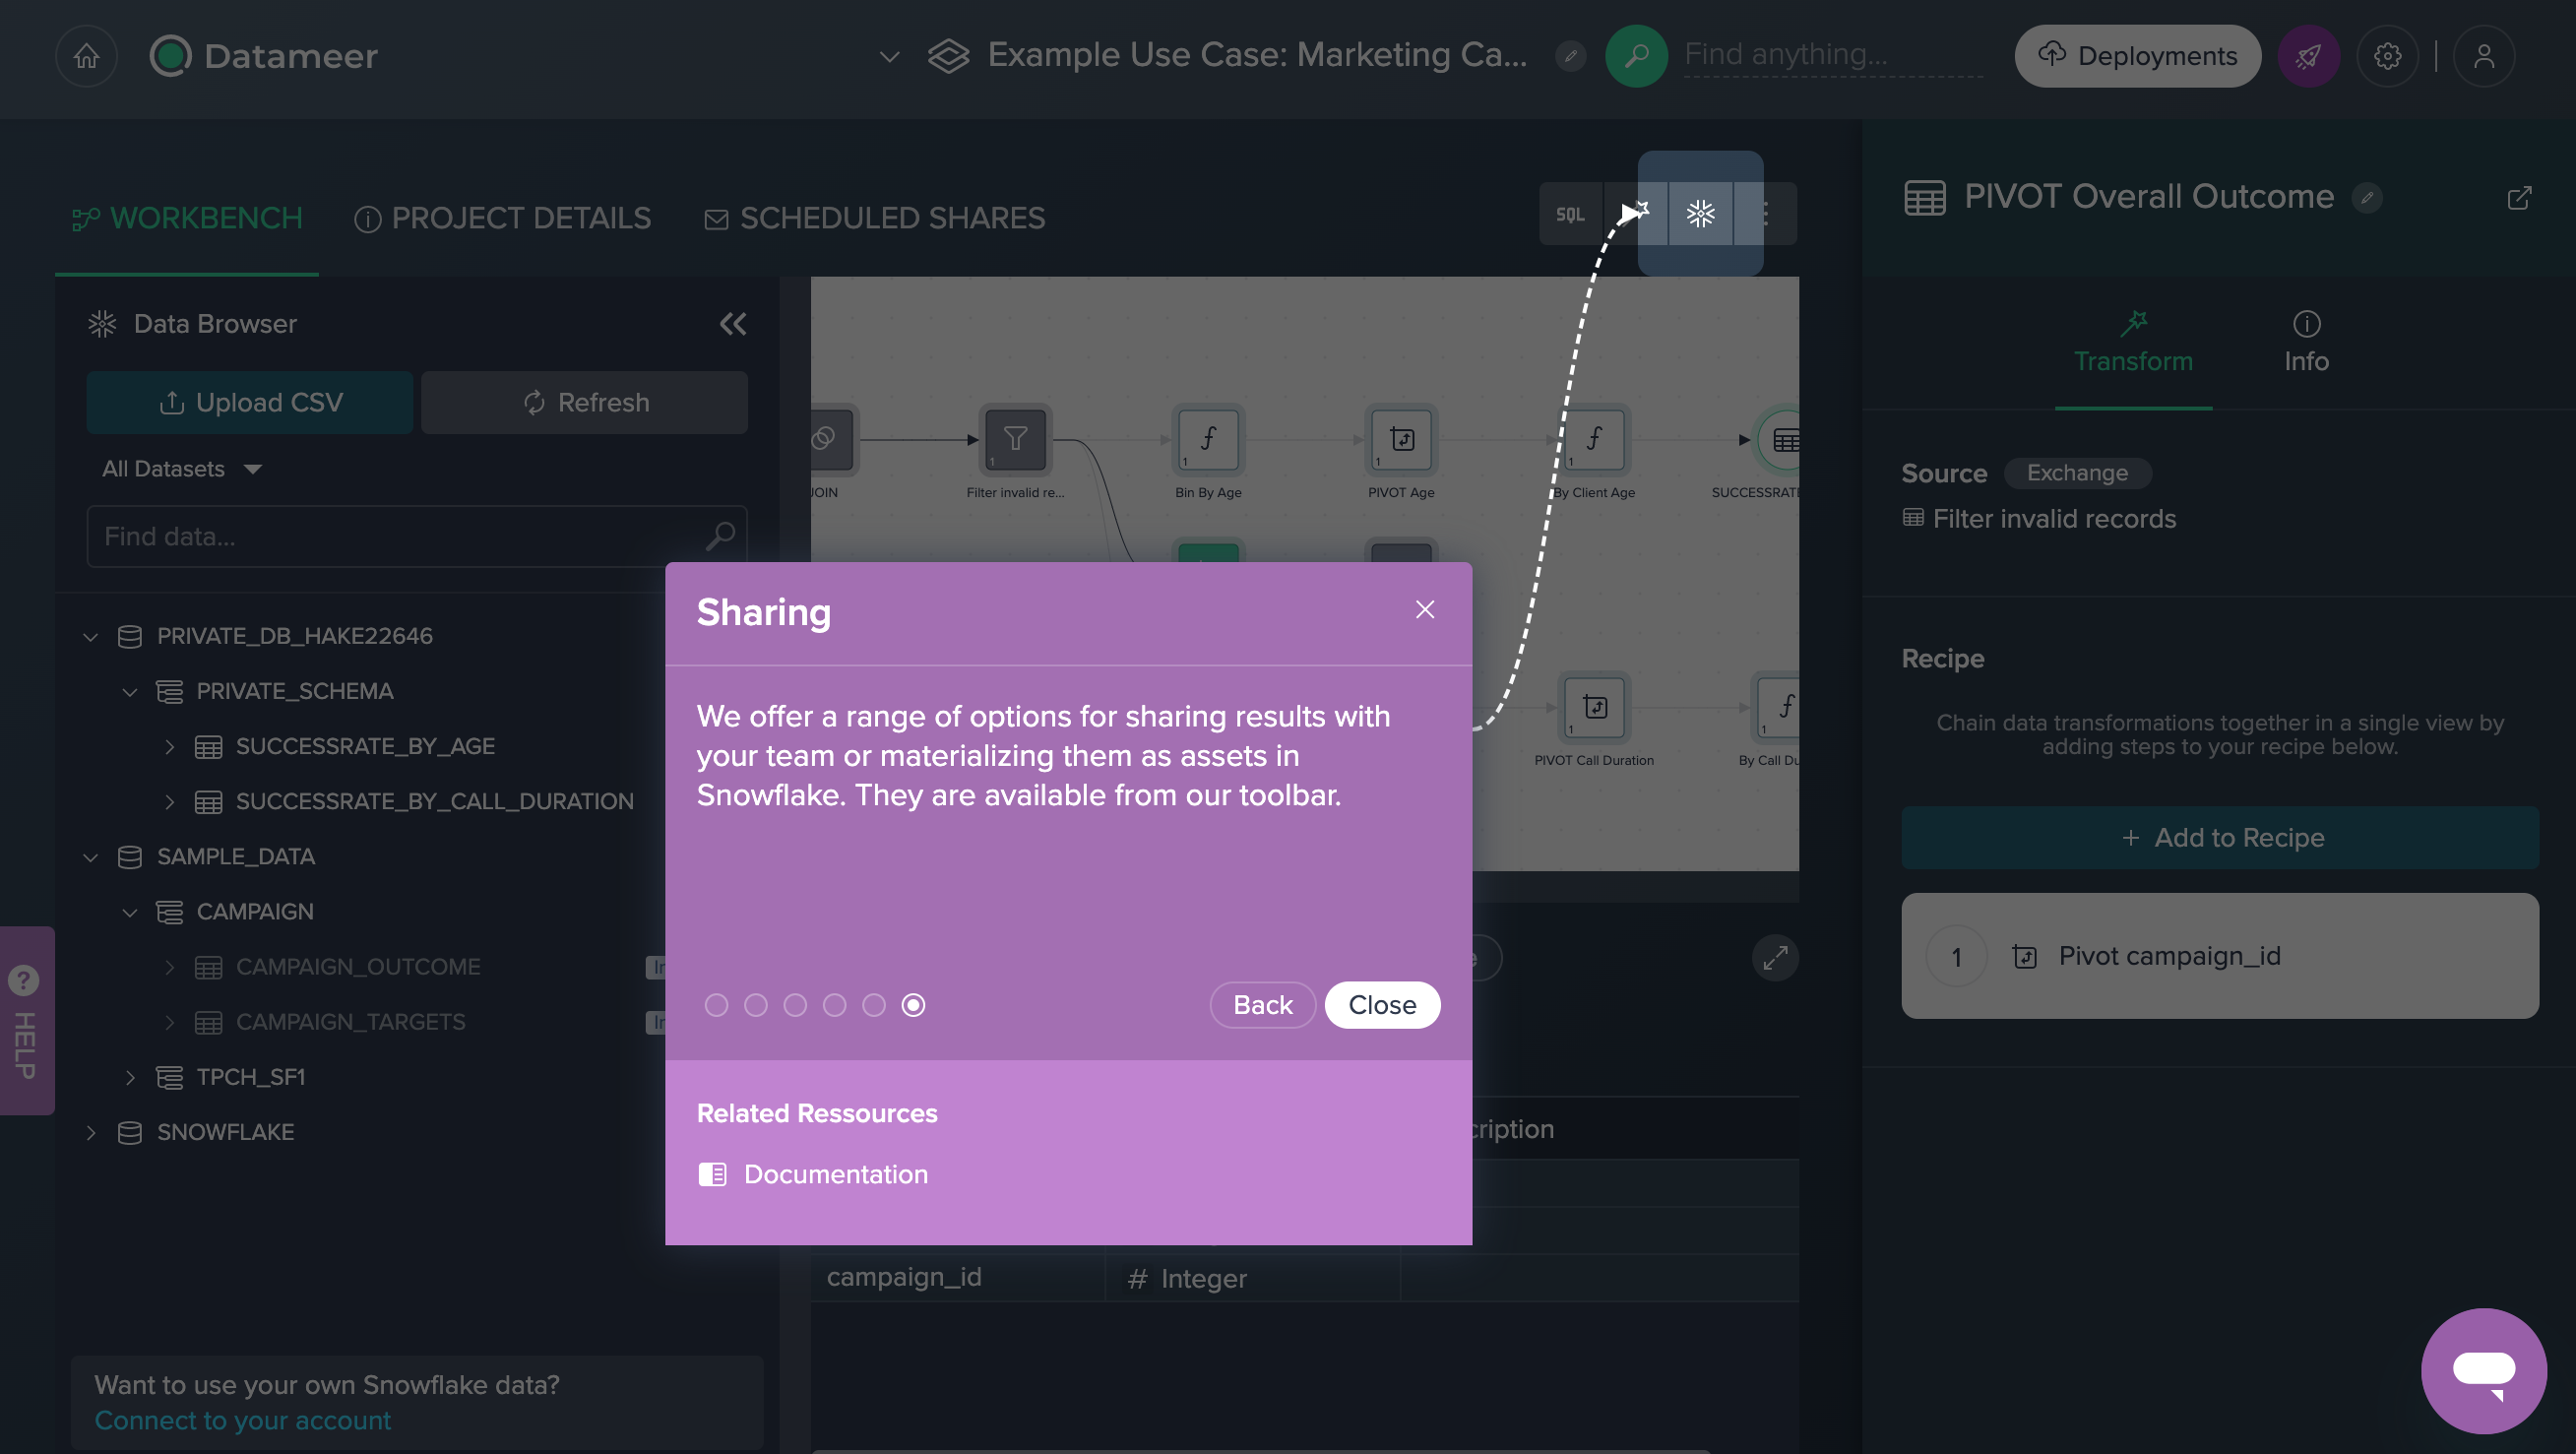
Providing SQL#
You can also create SQL statements for the campaign's success rate.
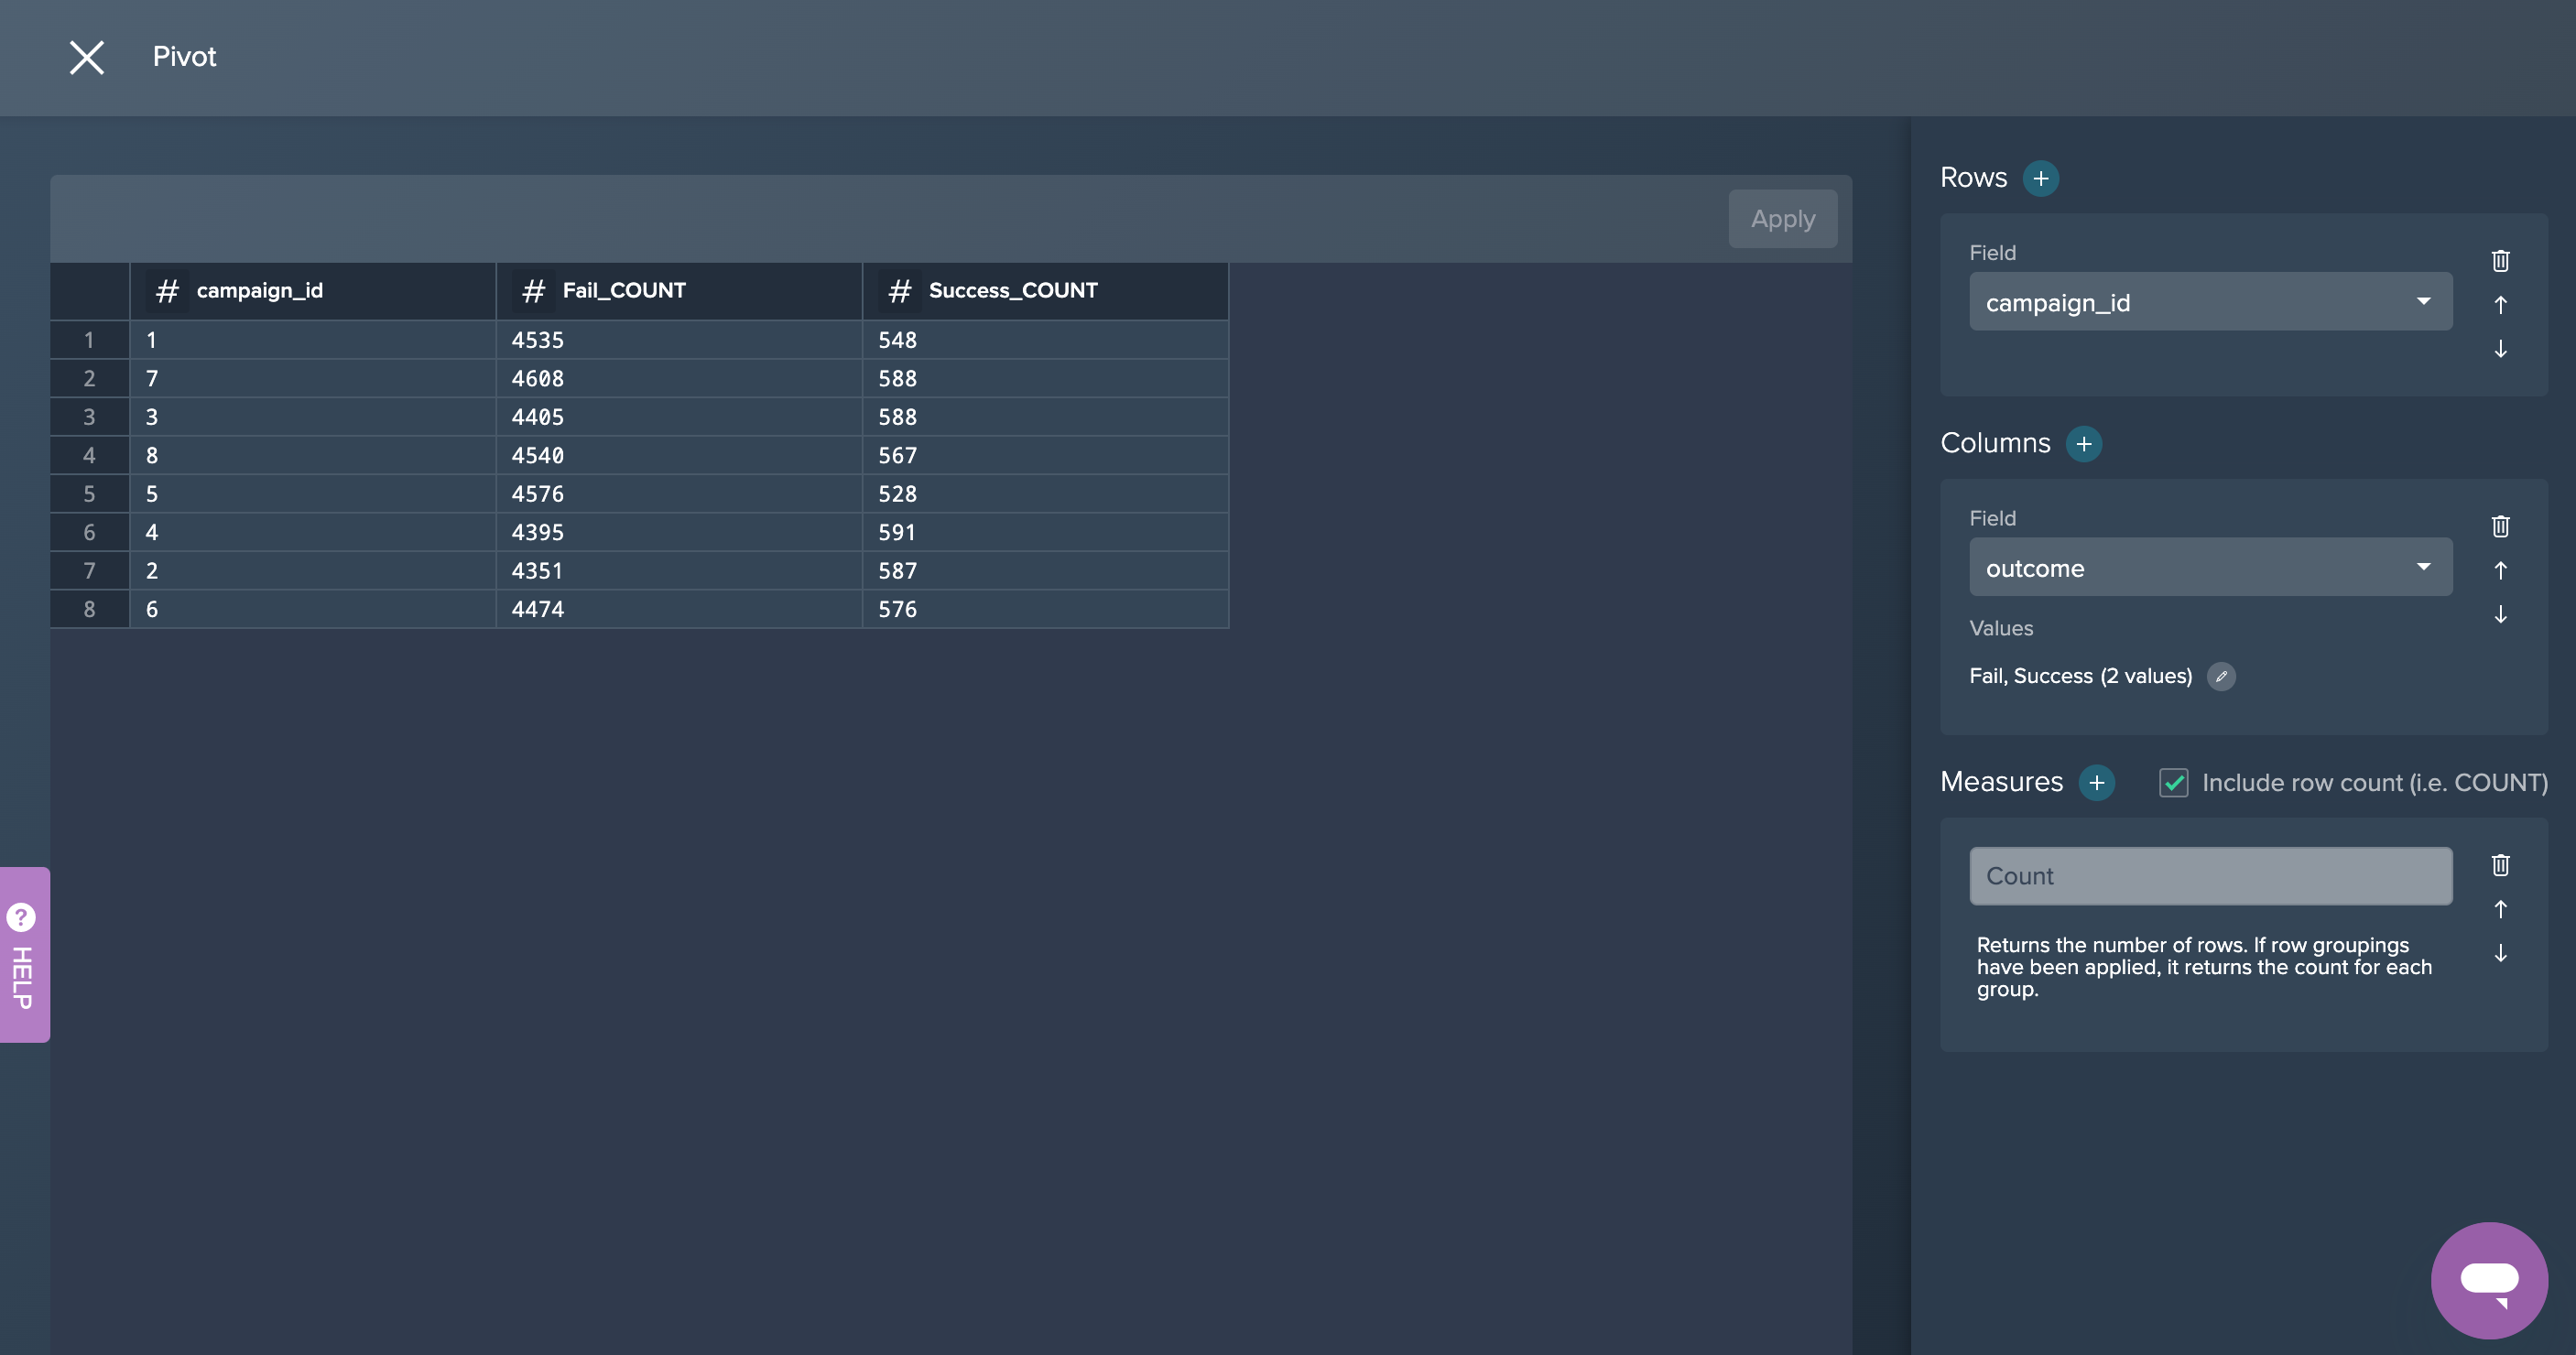
1. Pivot Overall Outline: First, the data has been pivoted by the 'campaign_id' whether the field 'outcome' was a fail or success. The measure was to count the amount of both values. This was done by applying the no-code operation 'PIVOT' in the Flow Area.

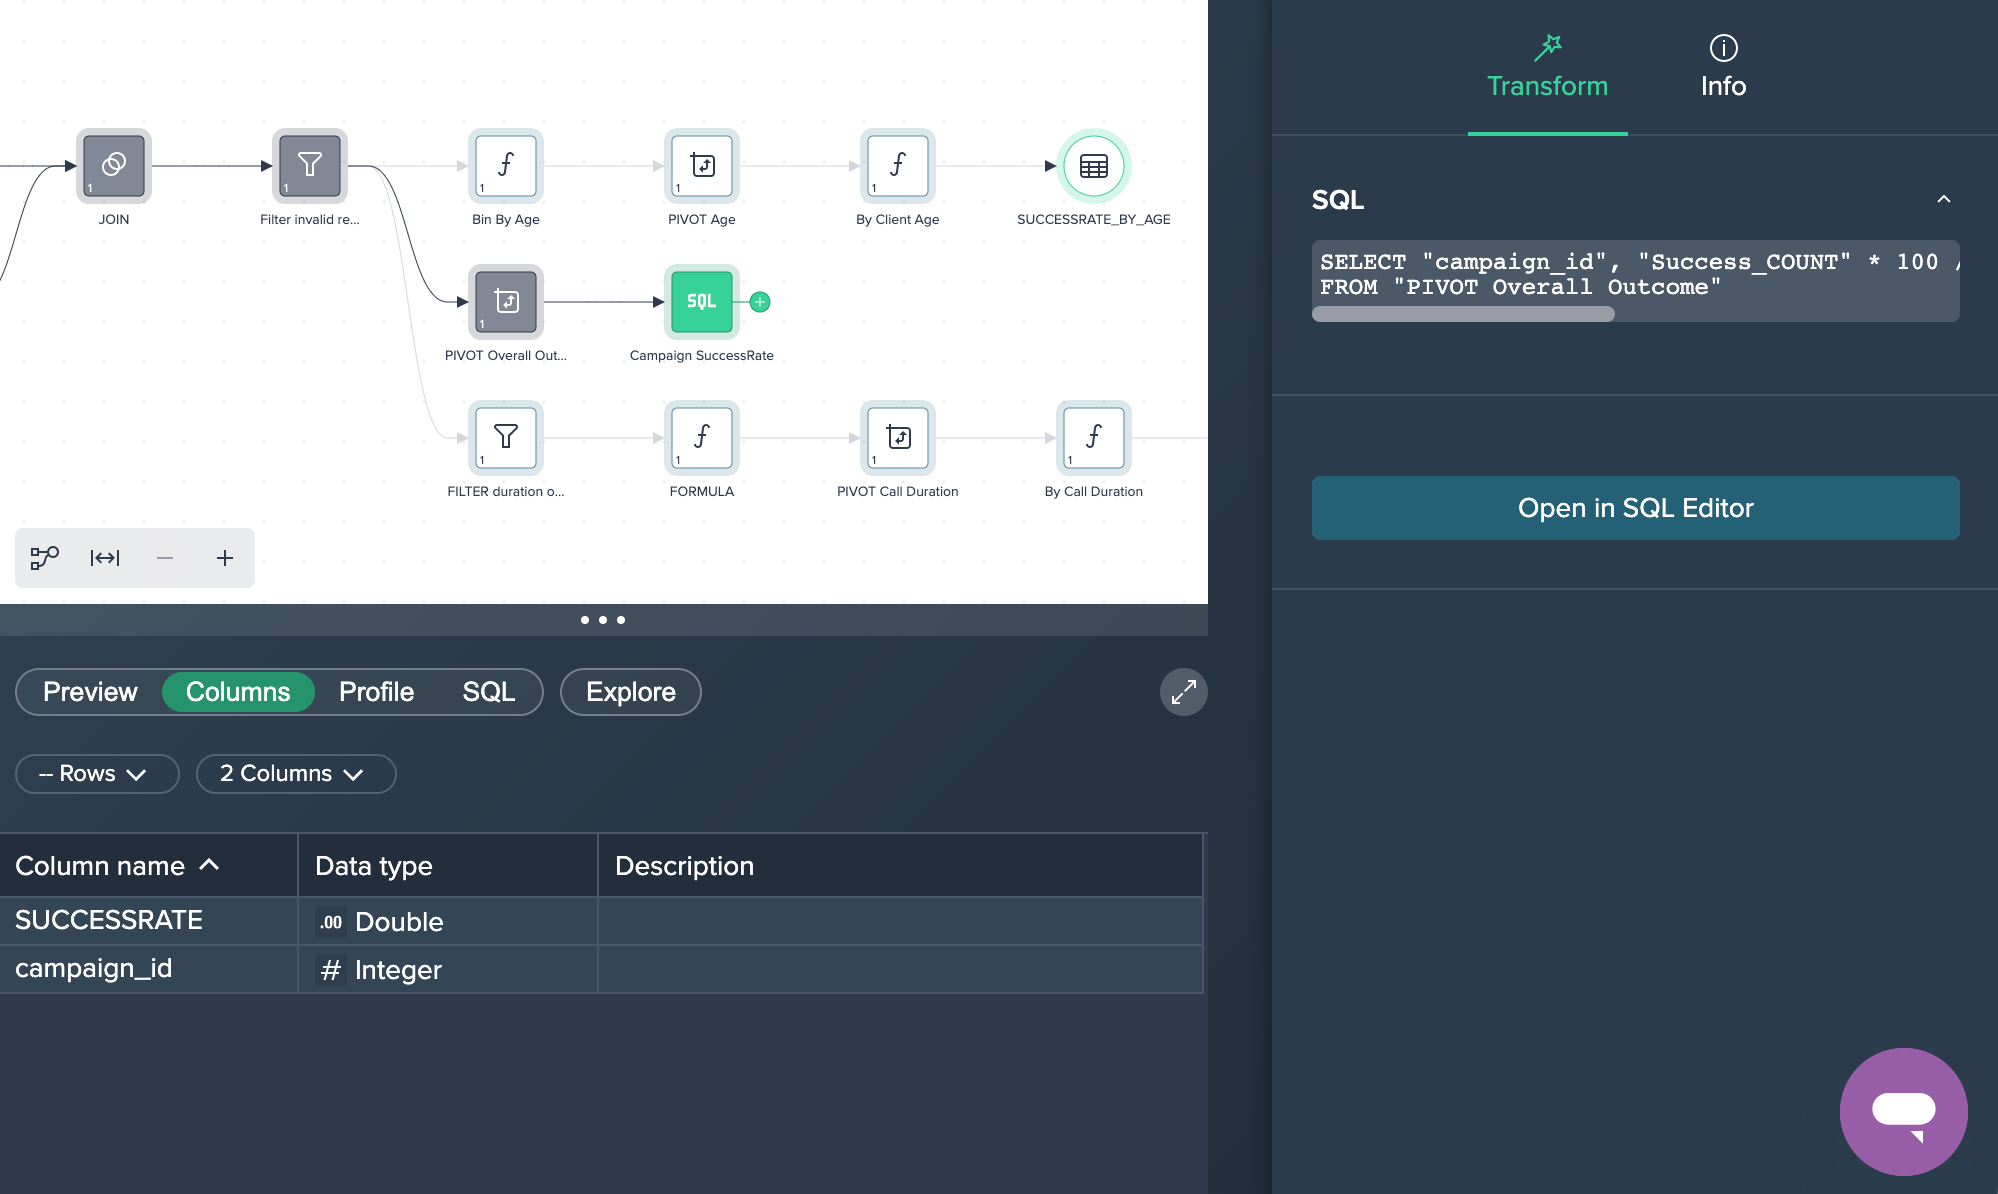
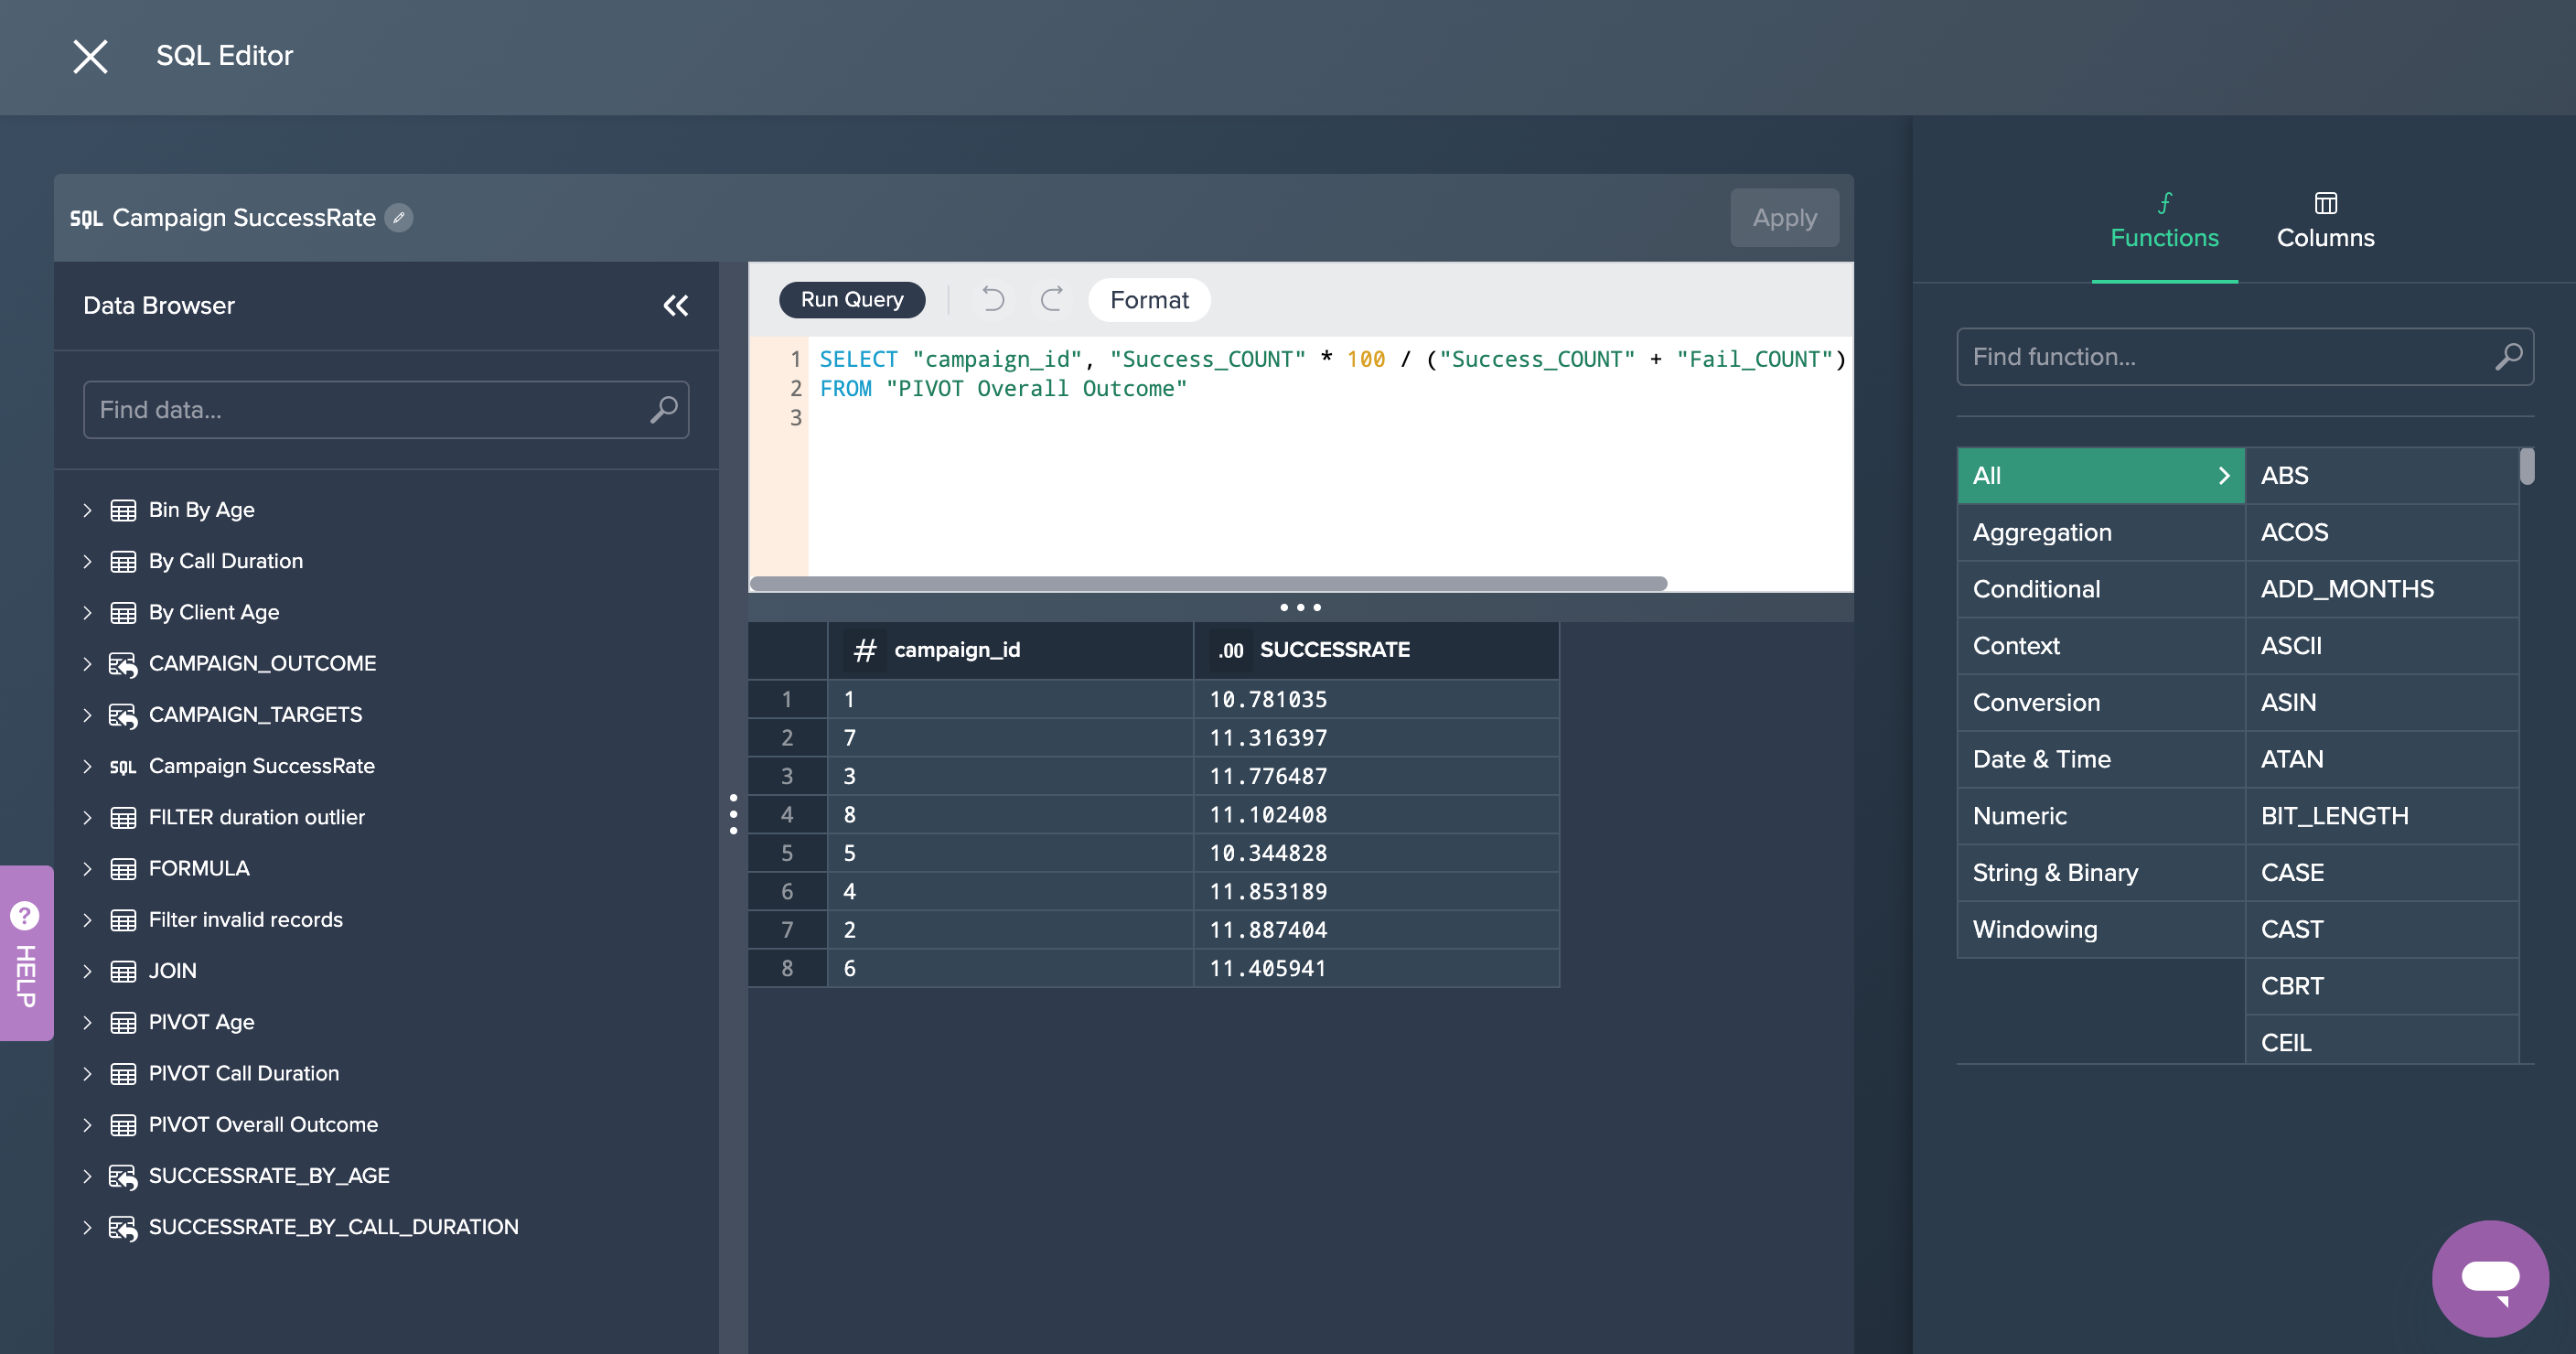
2. Campaign Successrate: This new node was created in the SQL Editor where the needed SQL statement has been added and run. This SQL query can also be copied later on. This partial goal was now successfully achieved.
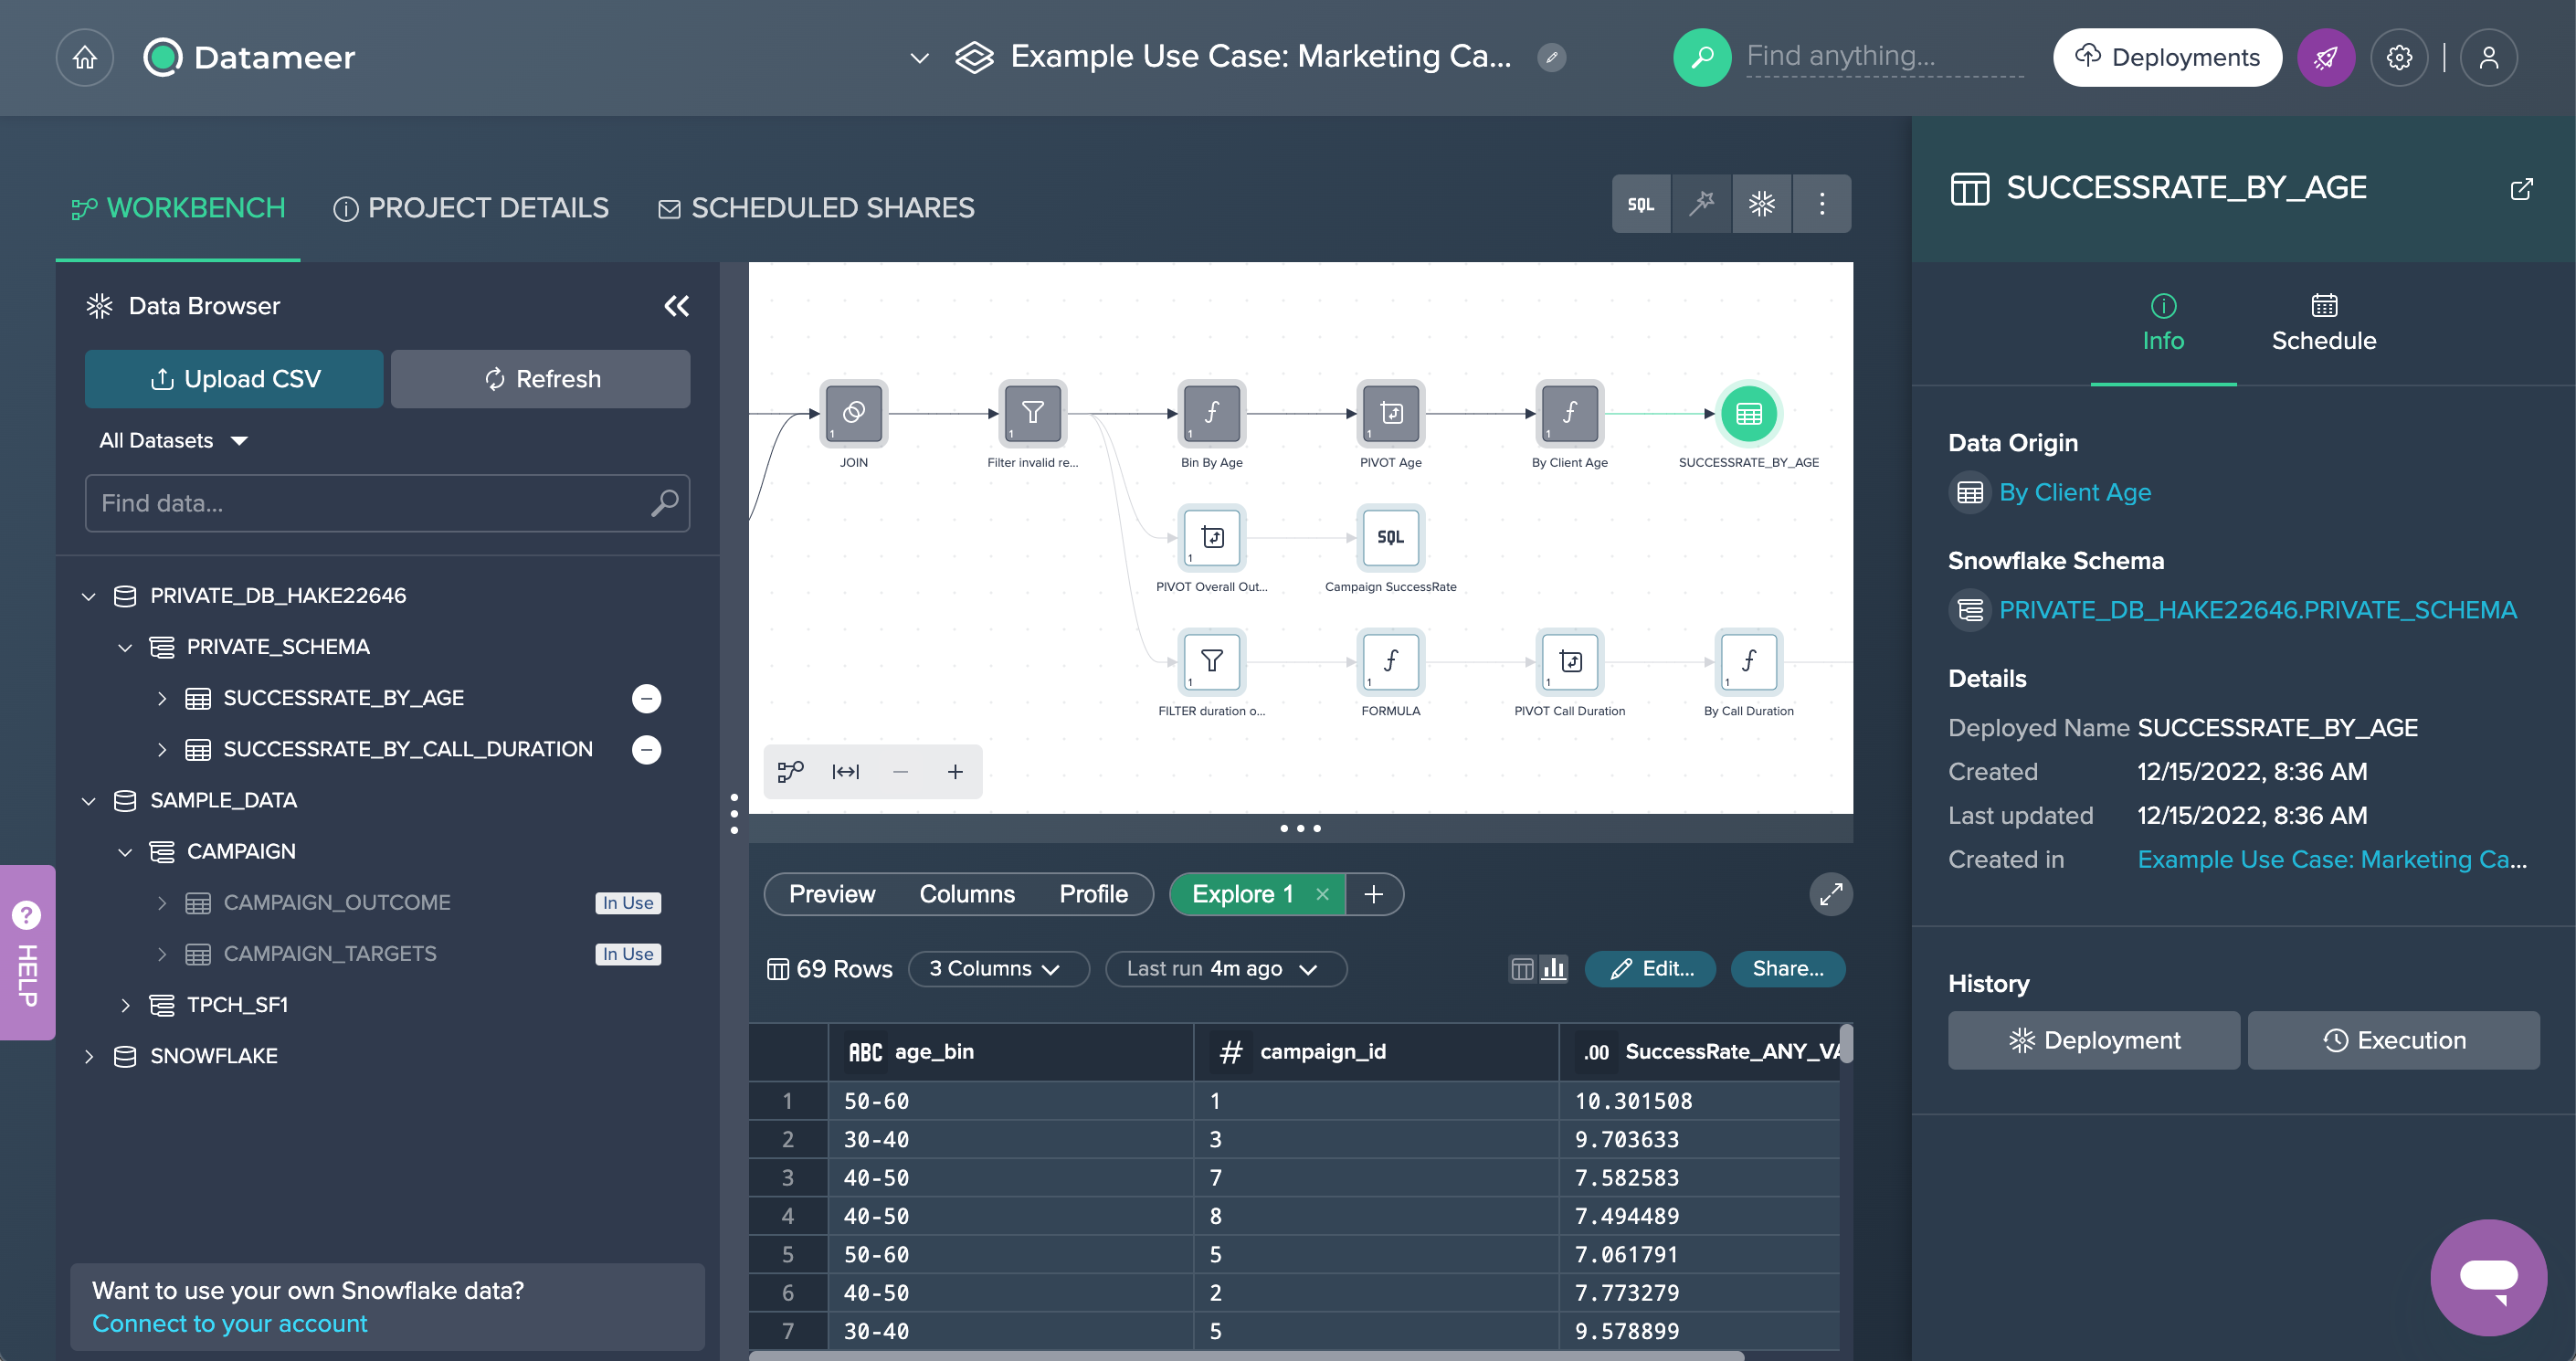
Deployment#
Finally, two of the intermediate data sets have been deployed to Snowflake: 'SUCCESSRATE_BY_AGE' and 'SUCCESSRATE_BY_CALL_DURATION'. For both deployed data sets, the Deployment History can be viewed and, if needed, also re-deployed. Each data set has also associated information in the Inspector and could be scheduled later on.
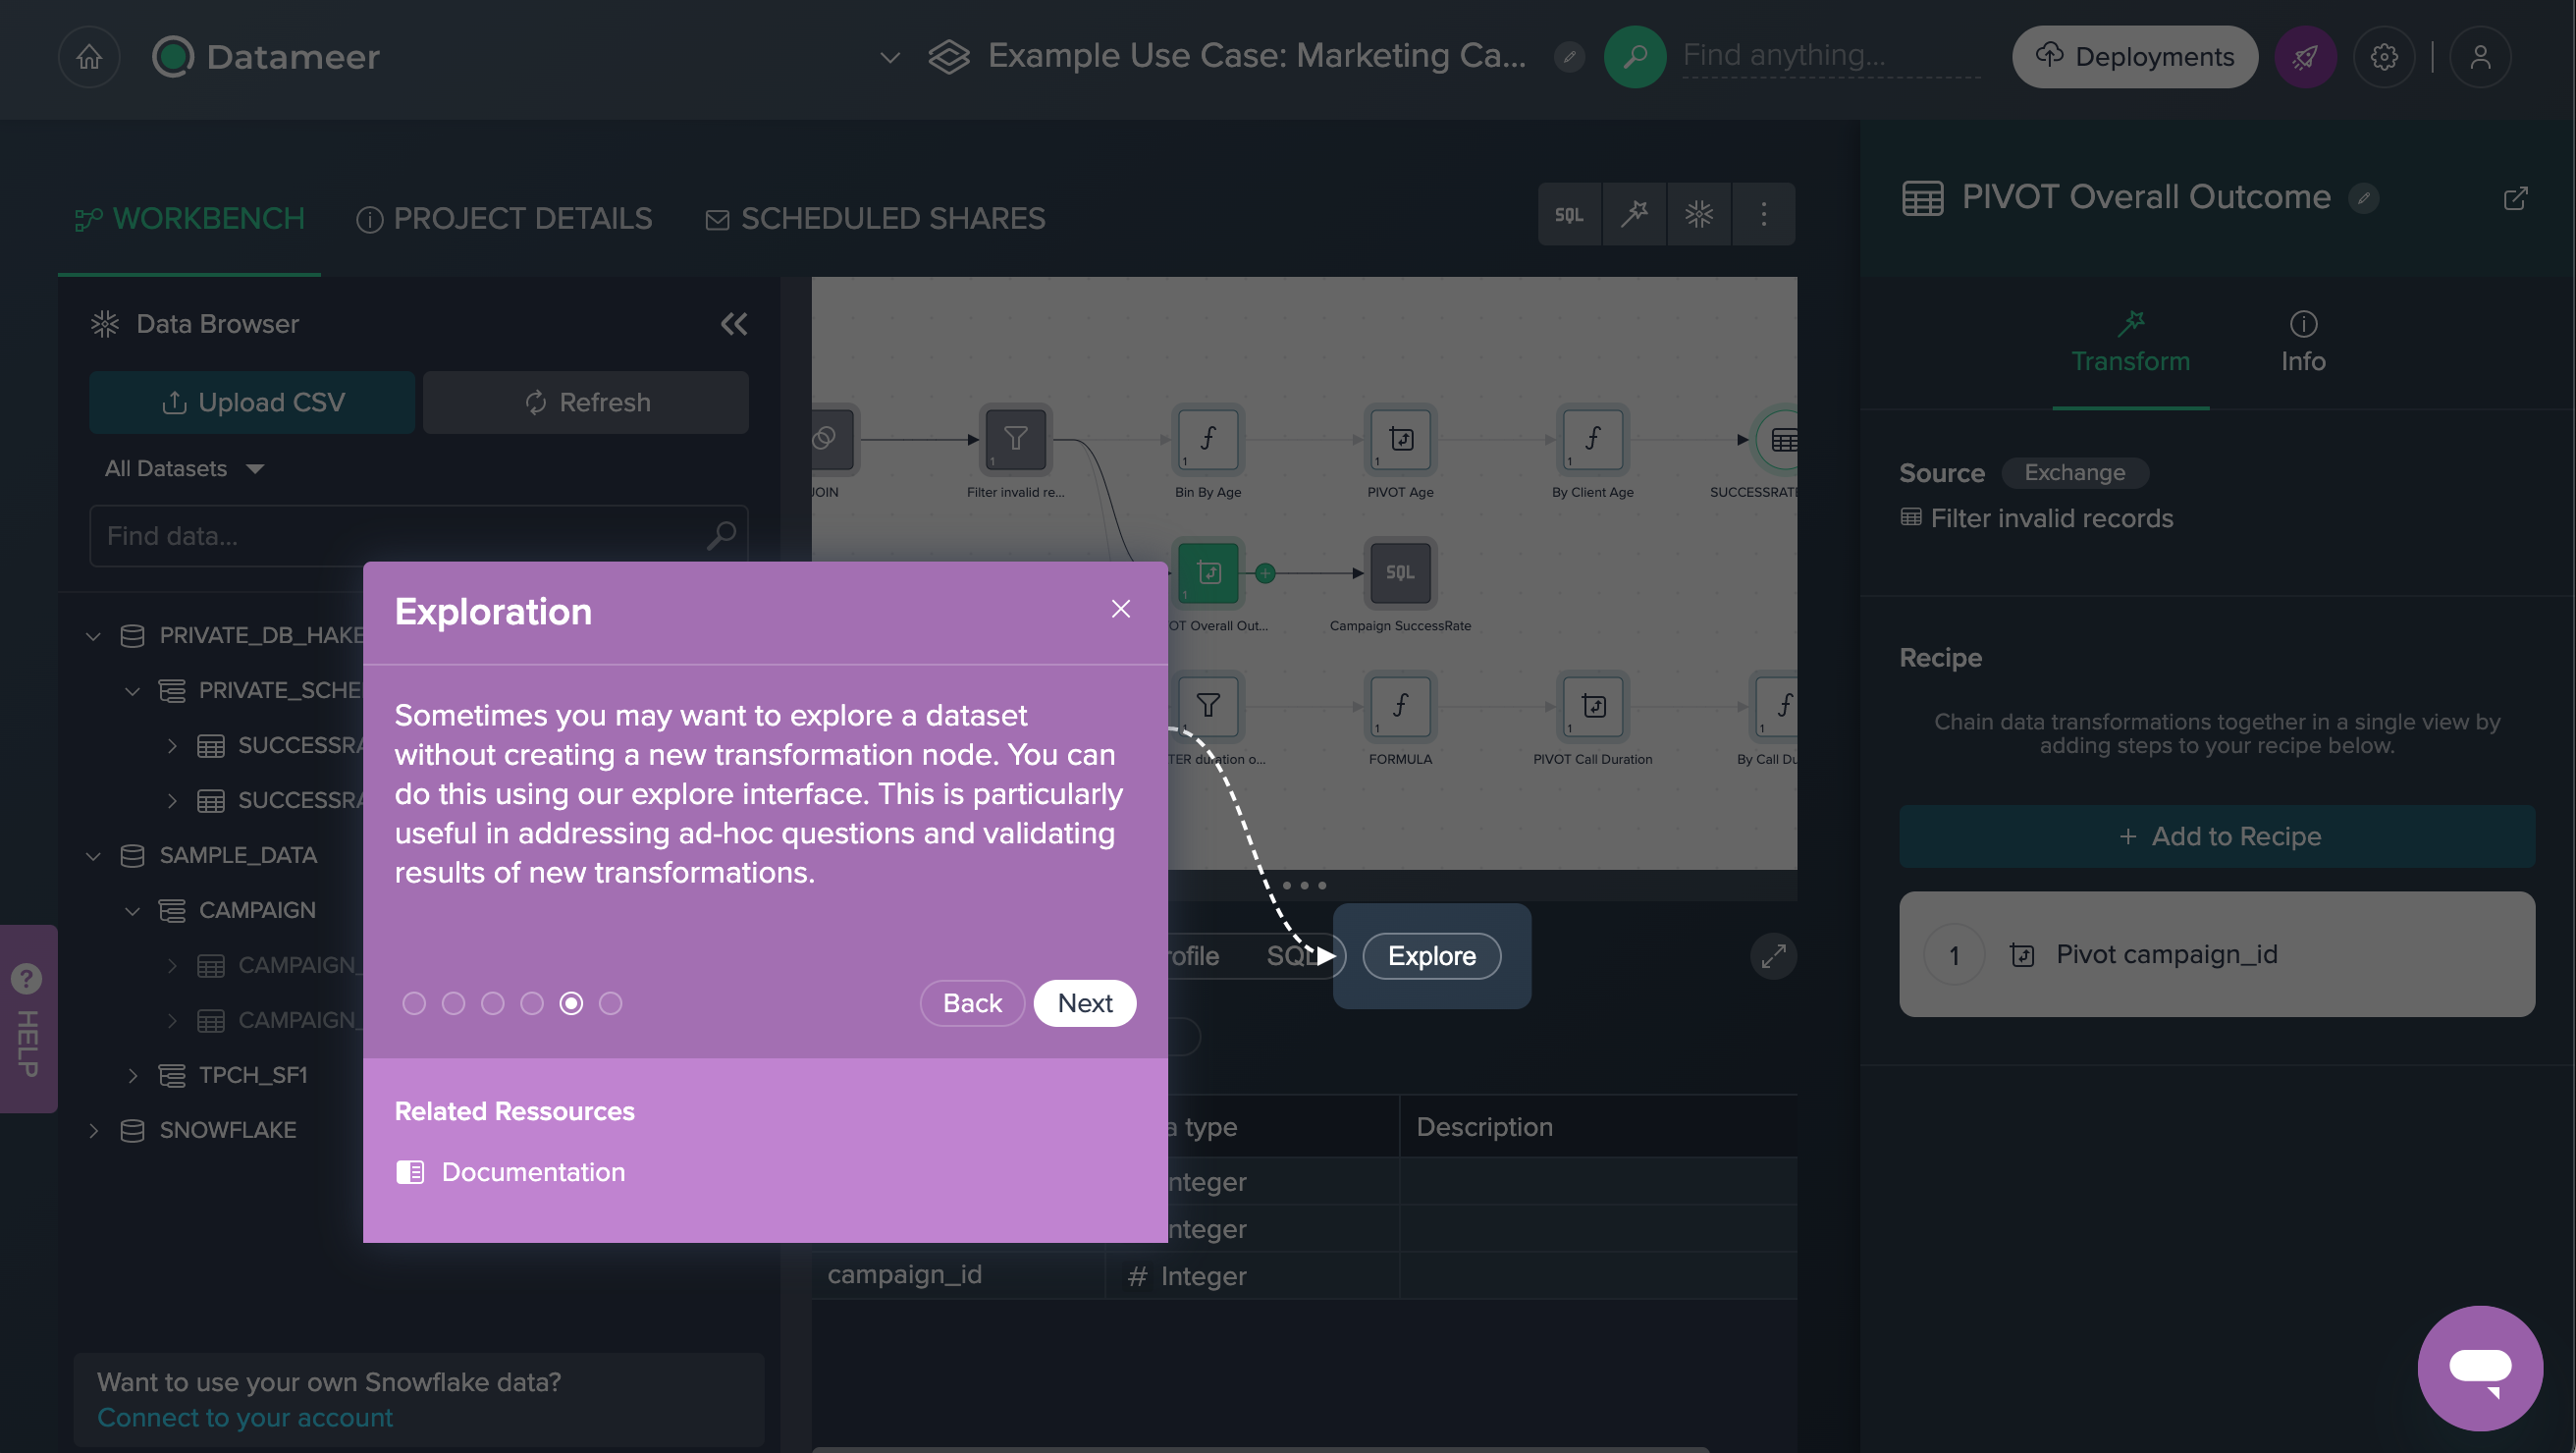
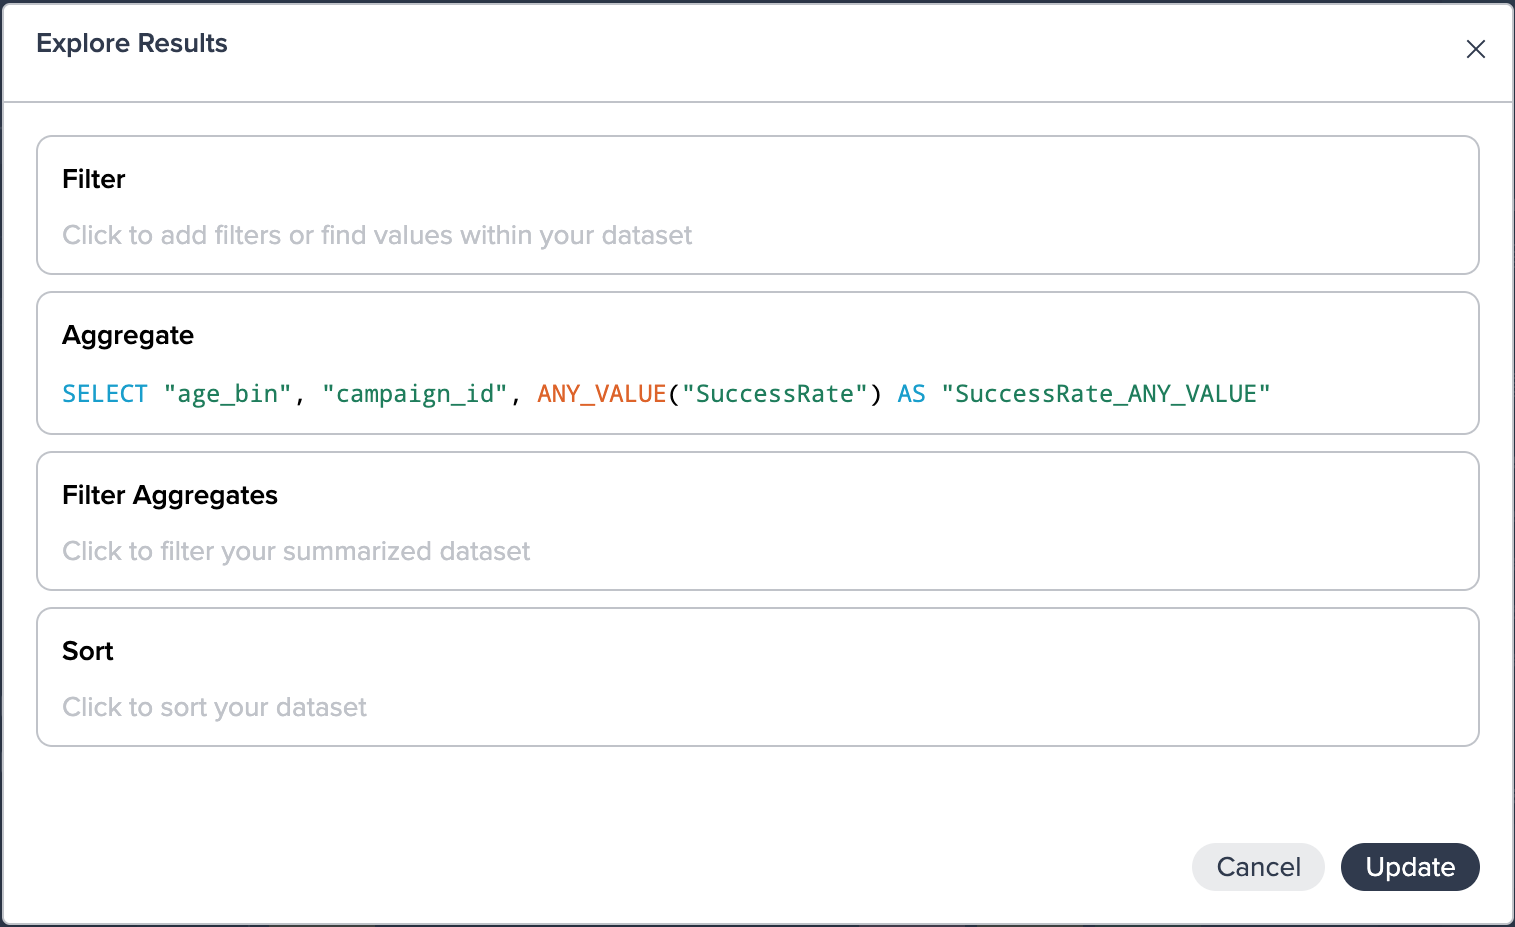
Exploration#
All data sets can be explored in the Data Grid. The following examples show, how to get a visual idea of the success results starting from several point of views.
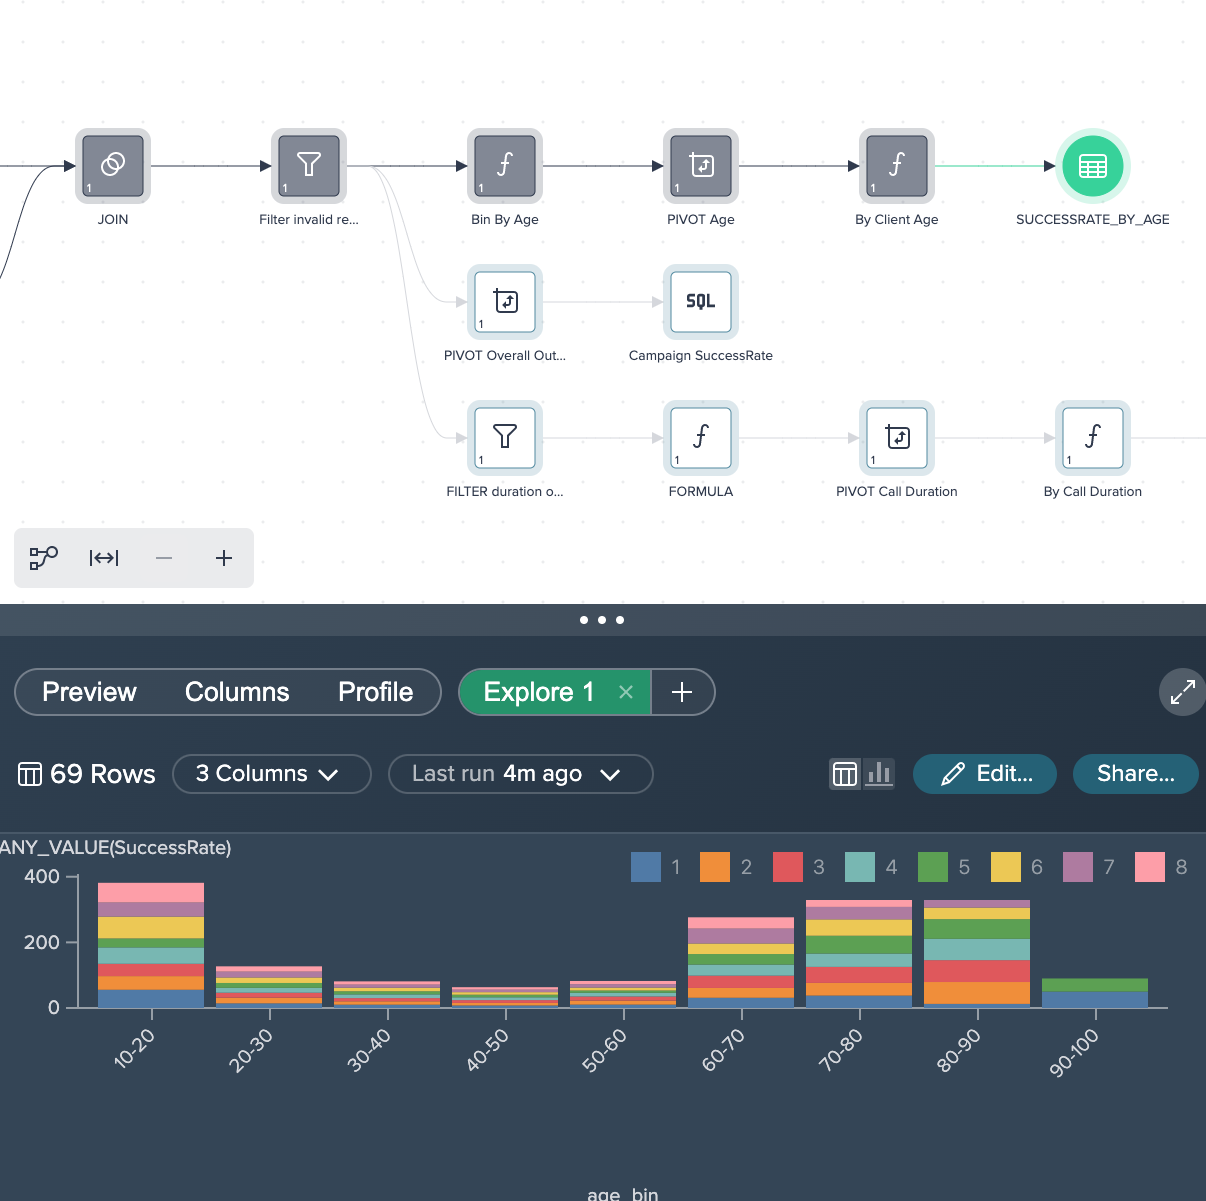
Success rate by age
Starting from the intermediate node 'By Client Age', the tab 'Explore' in the Data Grid offers the 'Explore 2' tab wherein the data is visualized by different age groups per average success rate. The graphic shows that most of the 80 to 90 years old people have the highest average success rate (51.04%).
Success rate by call duration
Starting from the intermediate node 'By Call Duration', the tab 'Explore 2' offers the visualization by different time duration per average success rate. The graphic shows that most of the successful purchases have been archived when the call duration was around 1,000 seconds.