Datameer Operations#
Extract JSON#
Use this operation to extract JSON data to a column.
Find additional information about exploring JSON data here.
The following applies:
- JSON data can be extracted as STRING, INTEGER, DOUBLE, DECIMAL, BOOLEAN, DATE, TIMESTAMP, VARIANT, ARRAY, OBJECT and GEOGRAPHY
- you can extract one or more attributes or objects in a row to new columns
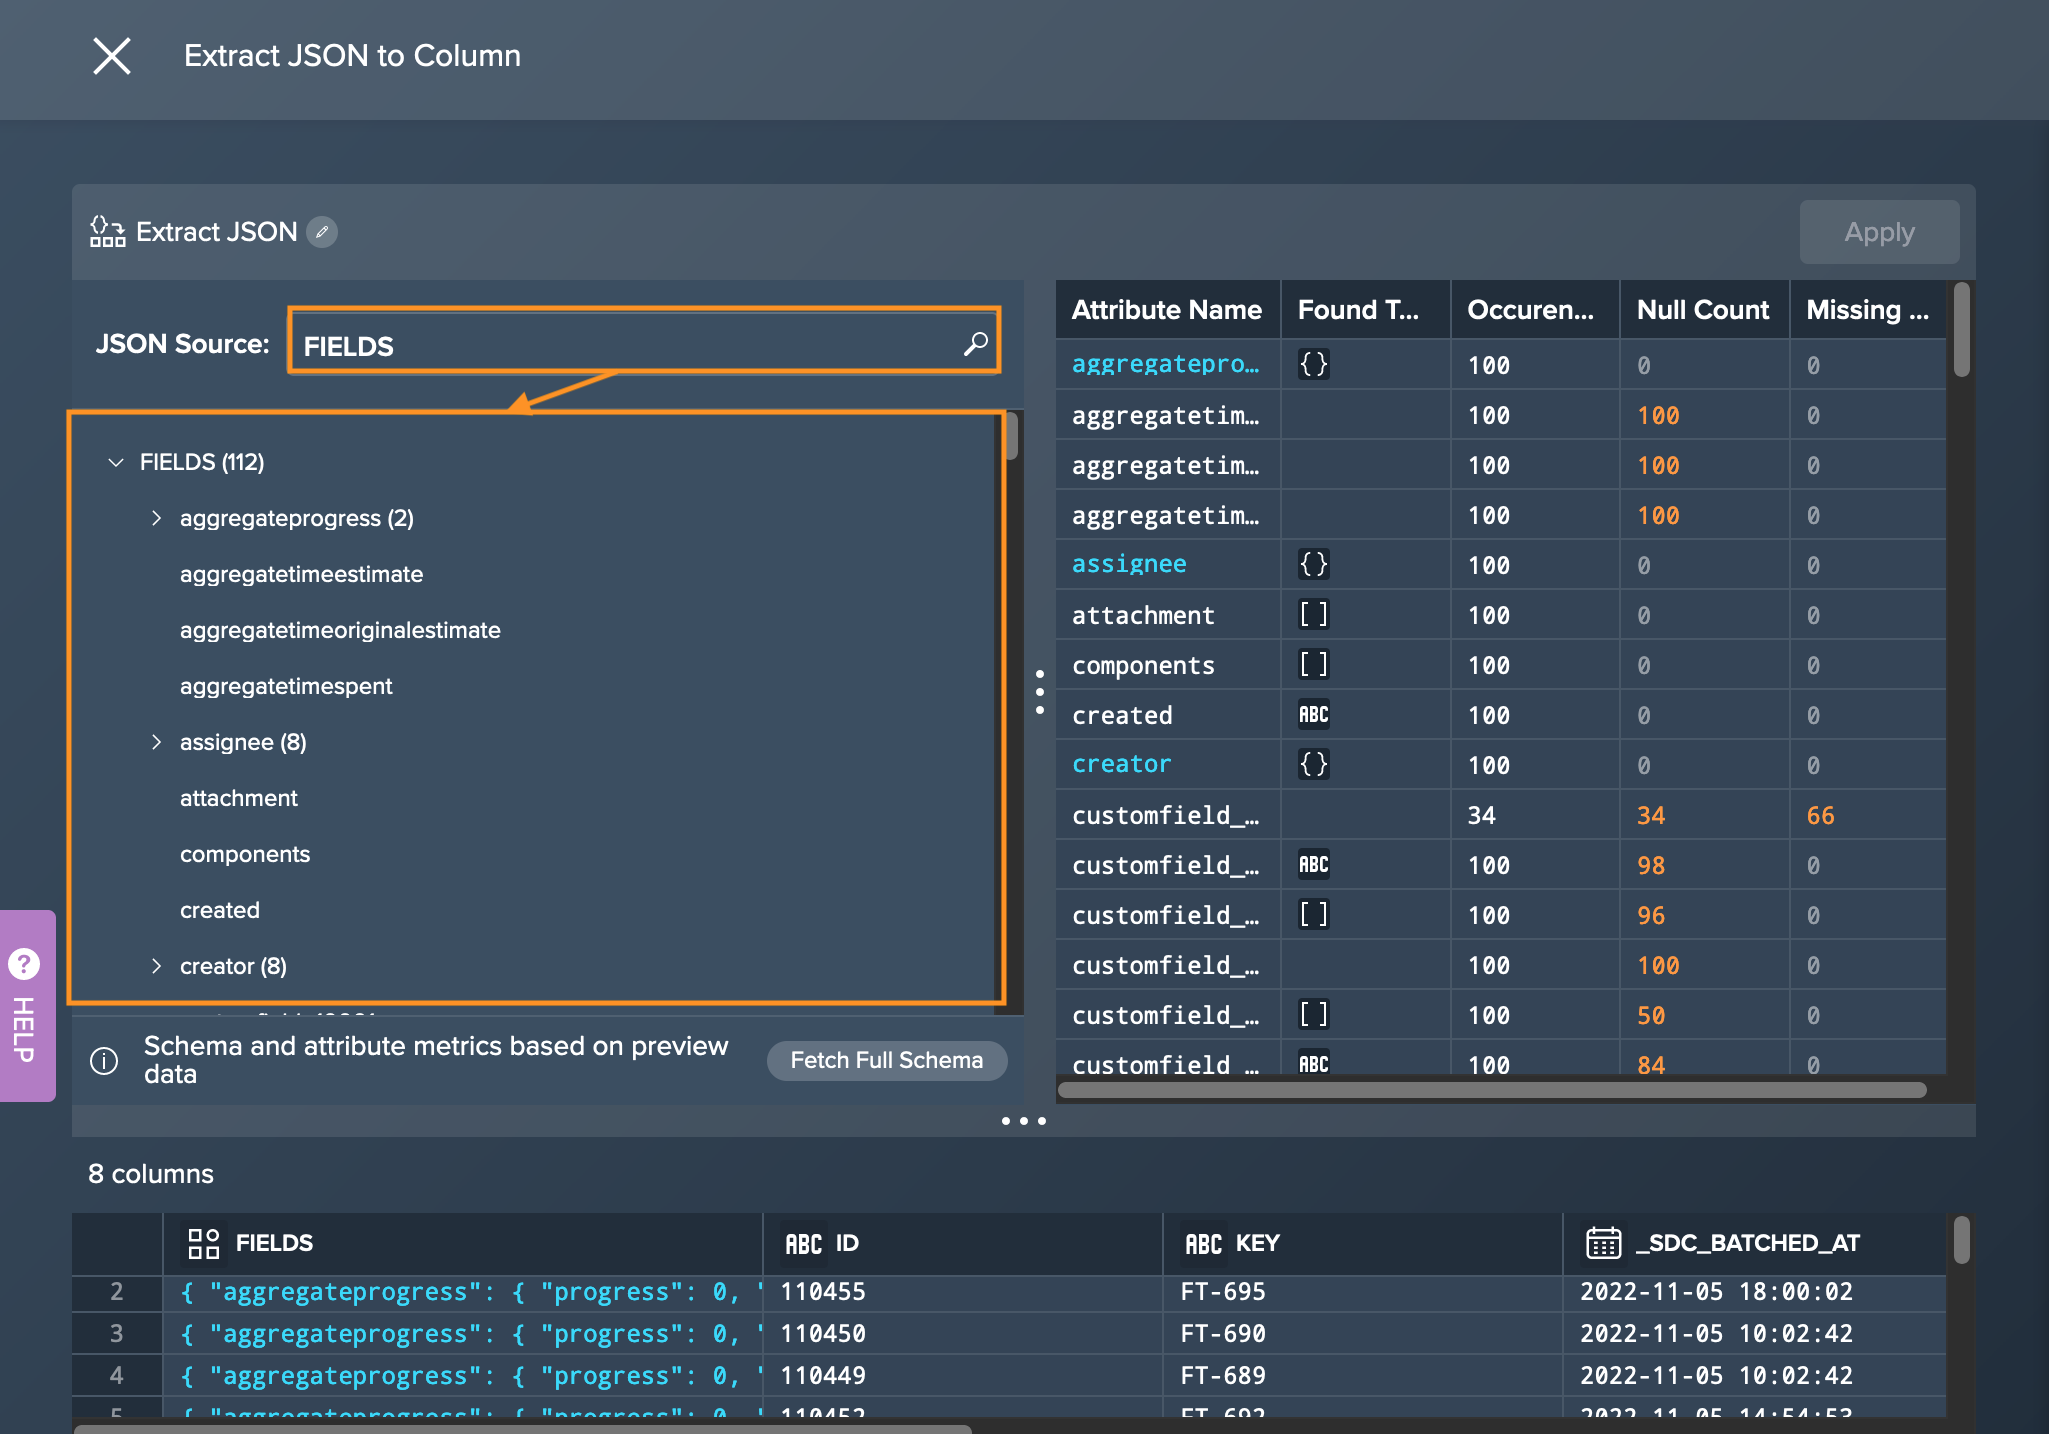
- schema and attribute metrics are based on preview data - the full schema can be fetched as well (but will take longer time in proceeding)
- in order to avoid errors when trying to parse huge JSON records, large values with more than 100,000 characters get truncated - the maximum value length can be configured via the property 'dataset.maximum-value-lenght'
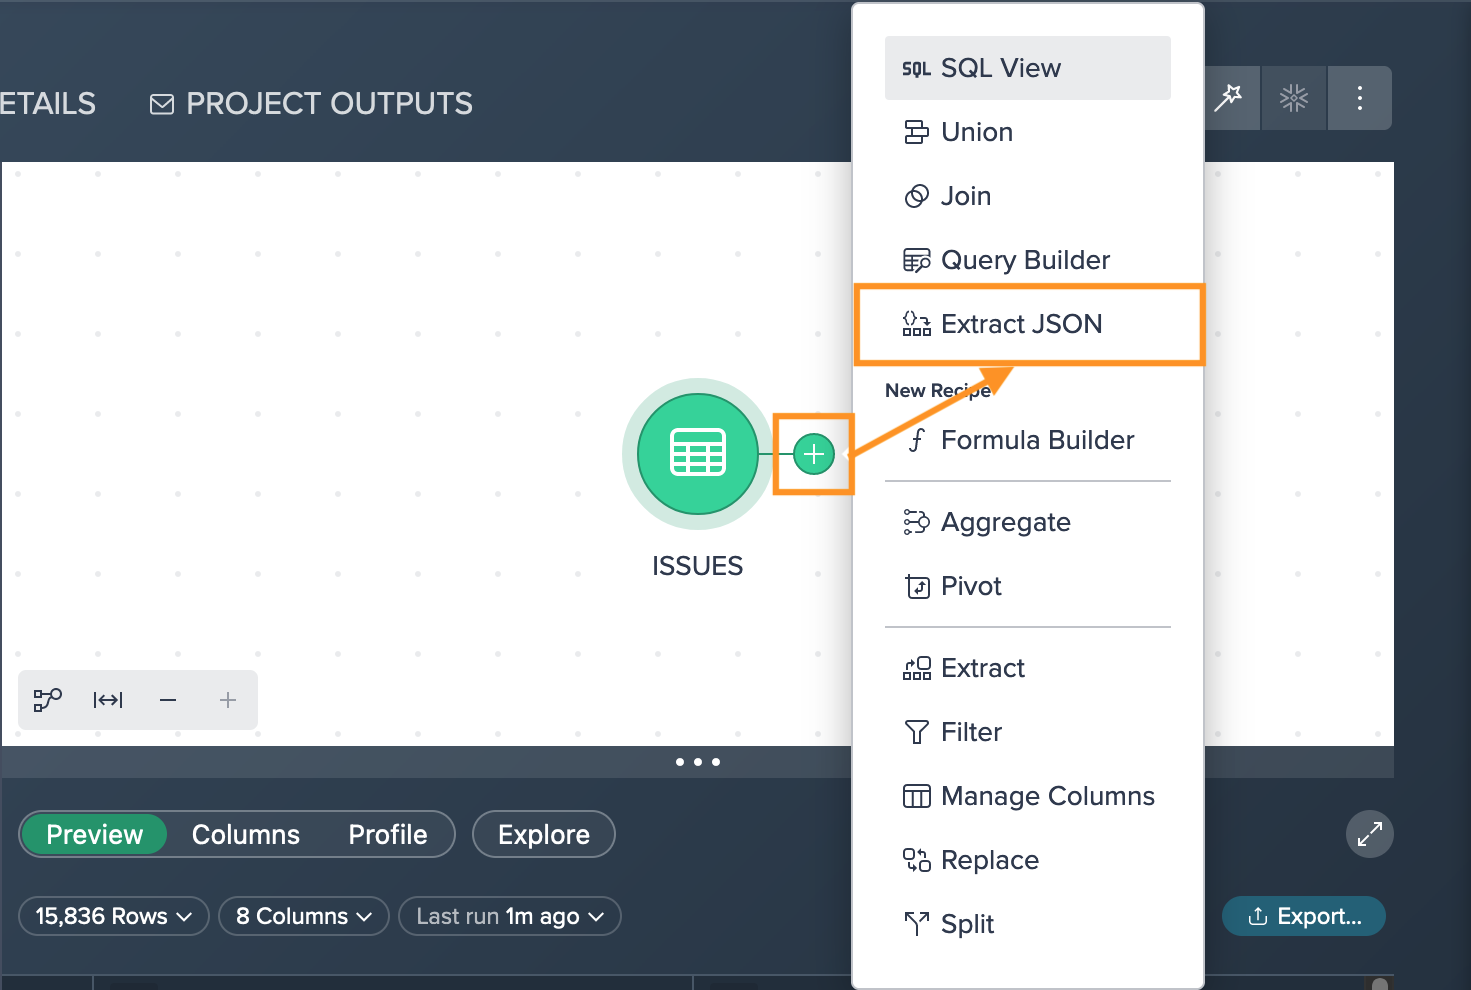
To extract JSON data to a column:
-
Click on the "+" next to the dataset and select "Extract JSON". The operations configuration opens.
-
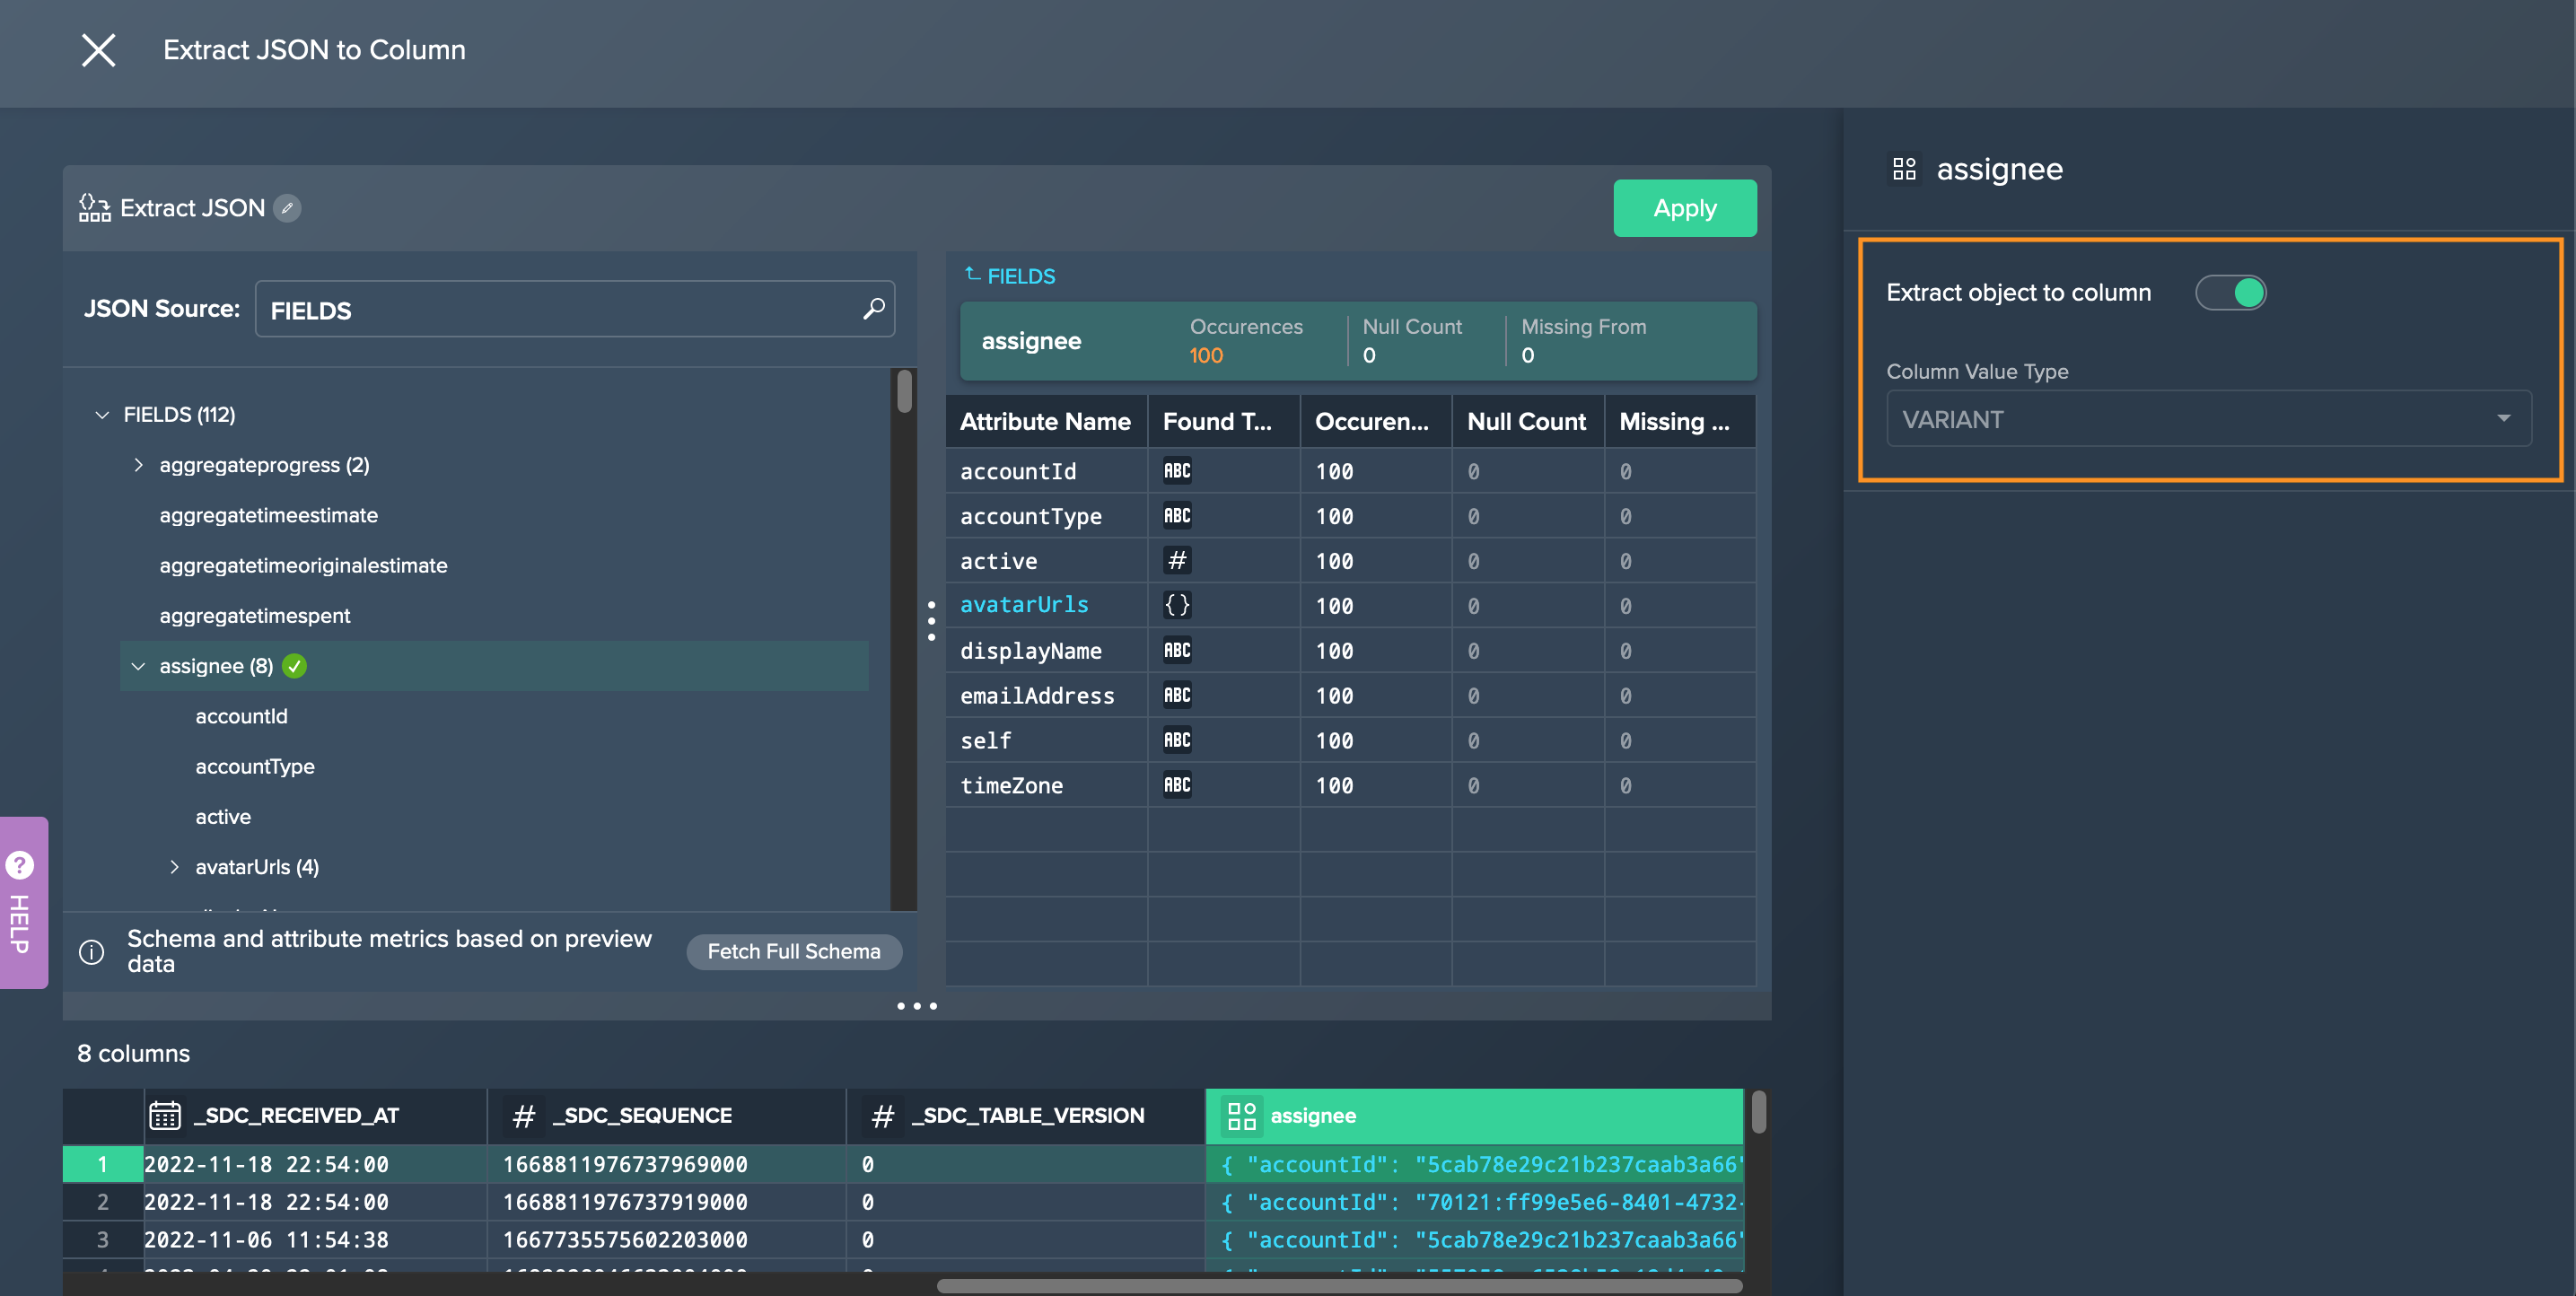
Select the JSON source from the dropdown and click on the required object or attribute. Note that for objects only coullmns from type 'VARIANT' can be extracted. The 'Object Attribute' section presents information.
-
Activate the "Extract object to column" switch and select the value type for the new column from the dropdown below. The new extract column appears in the preview and is named as object or attribute name.
-
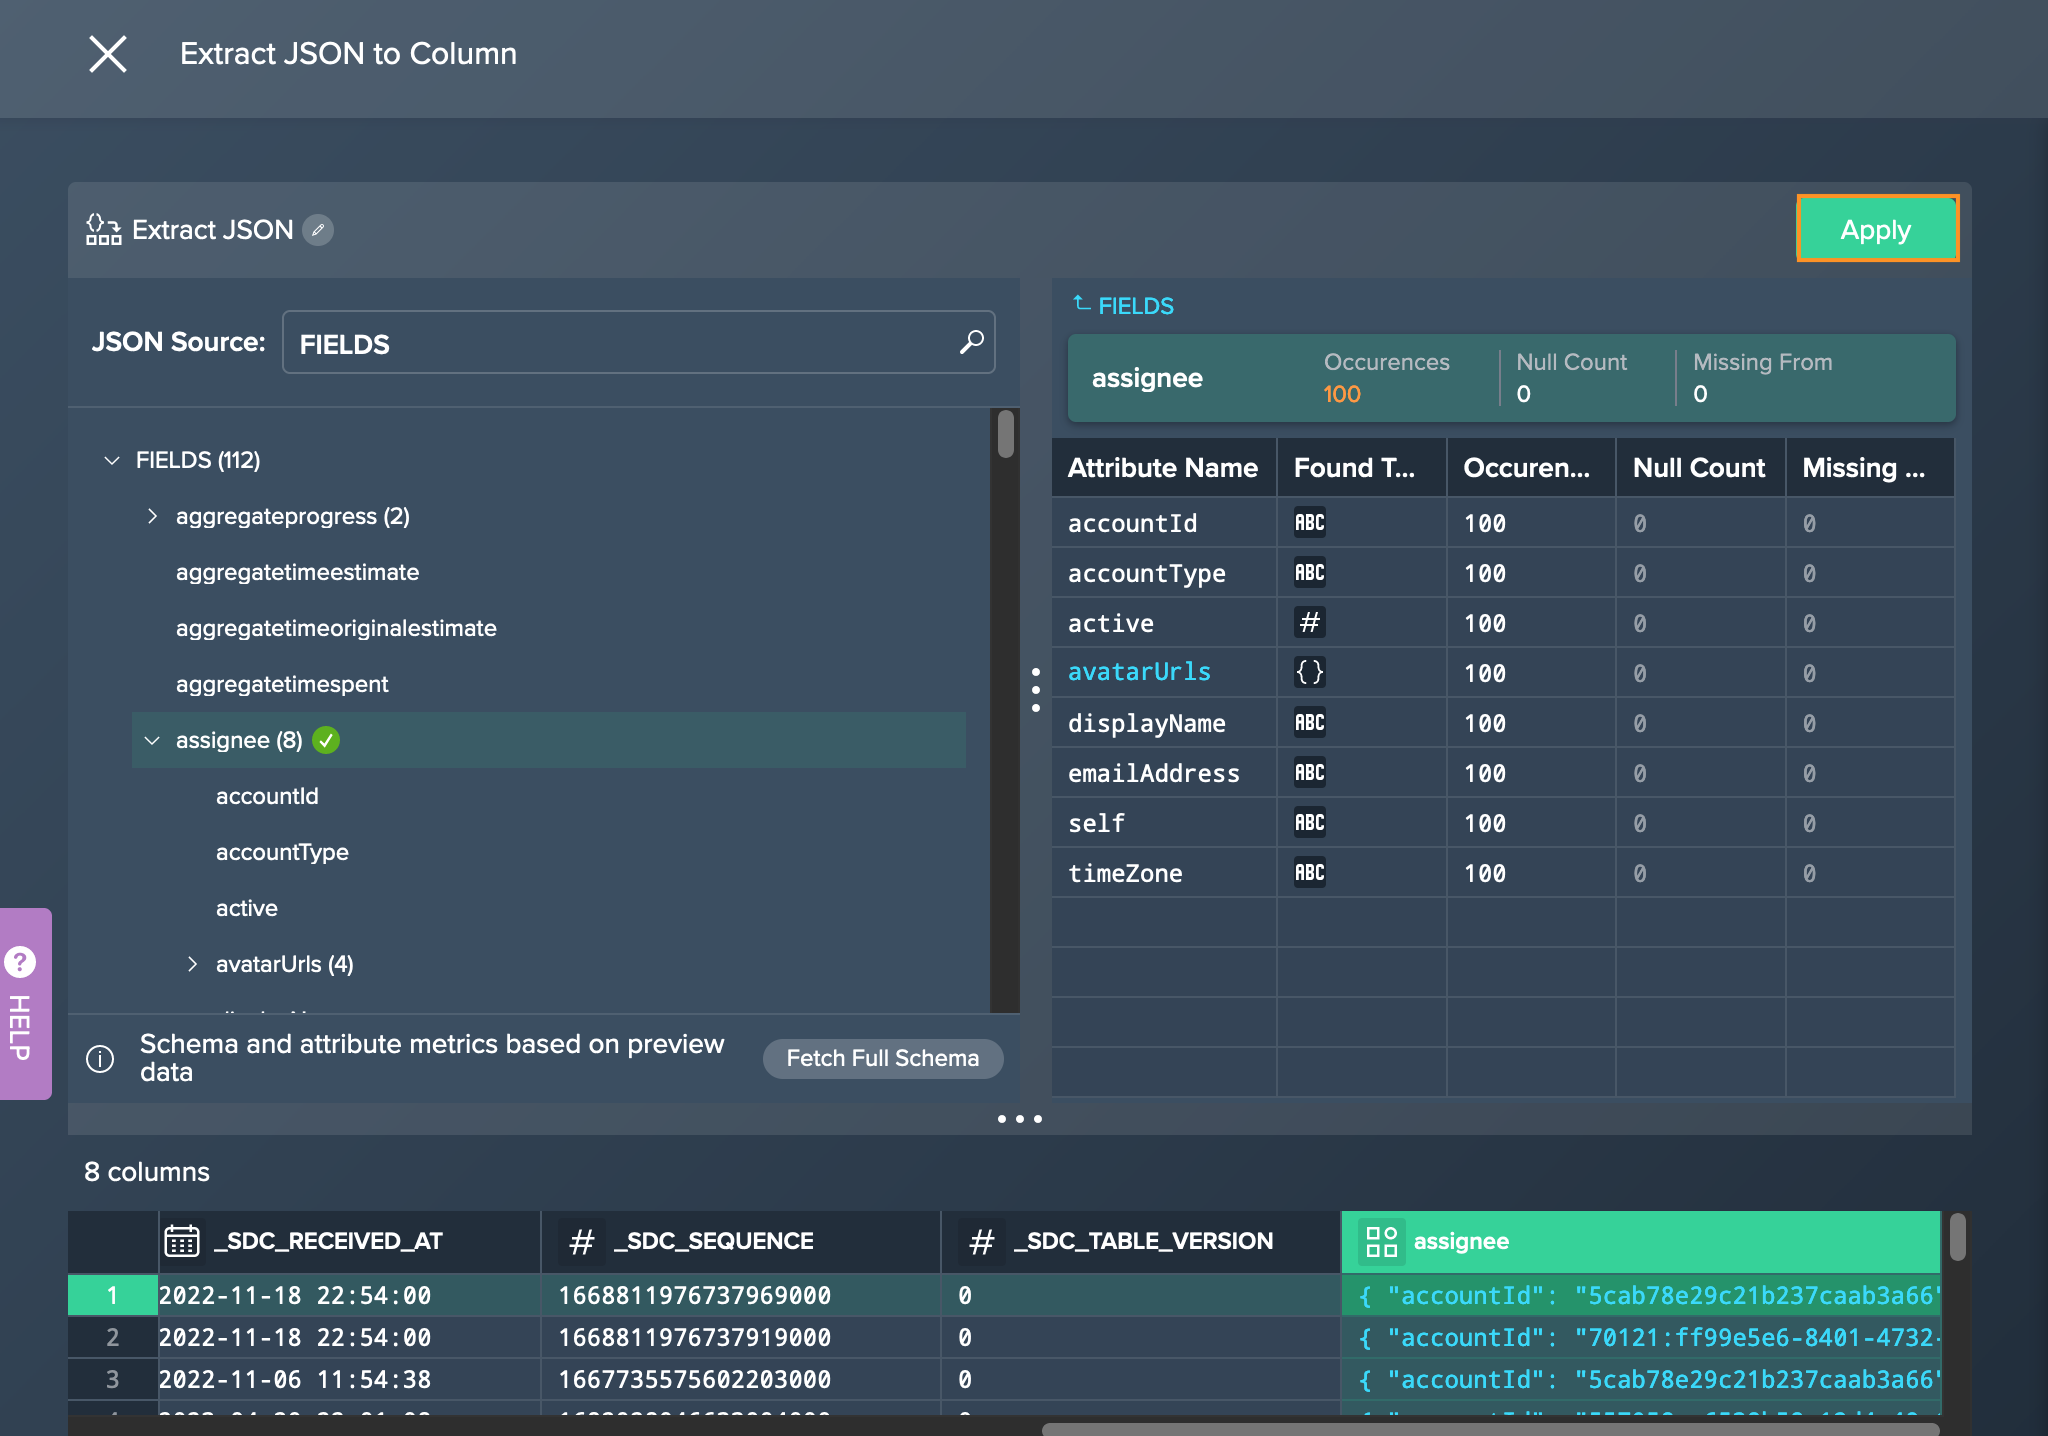
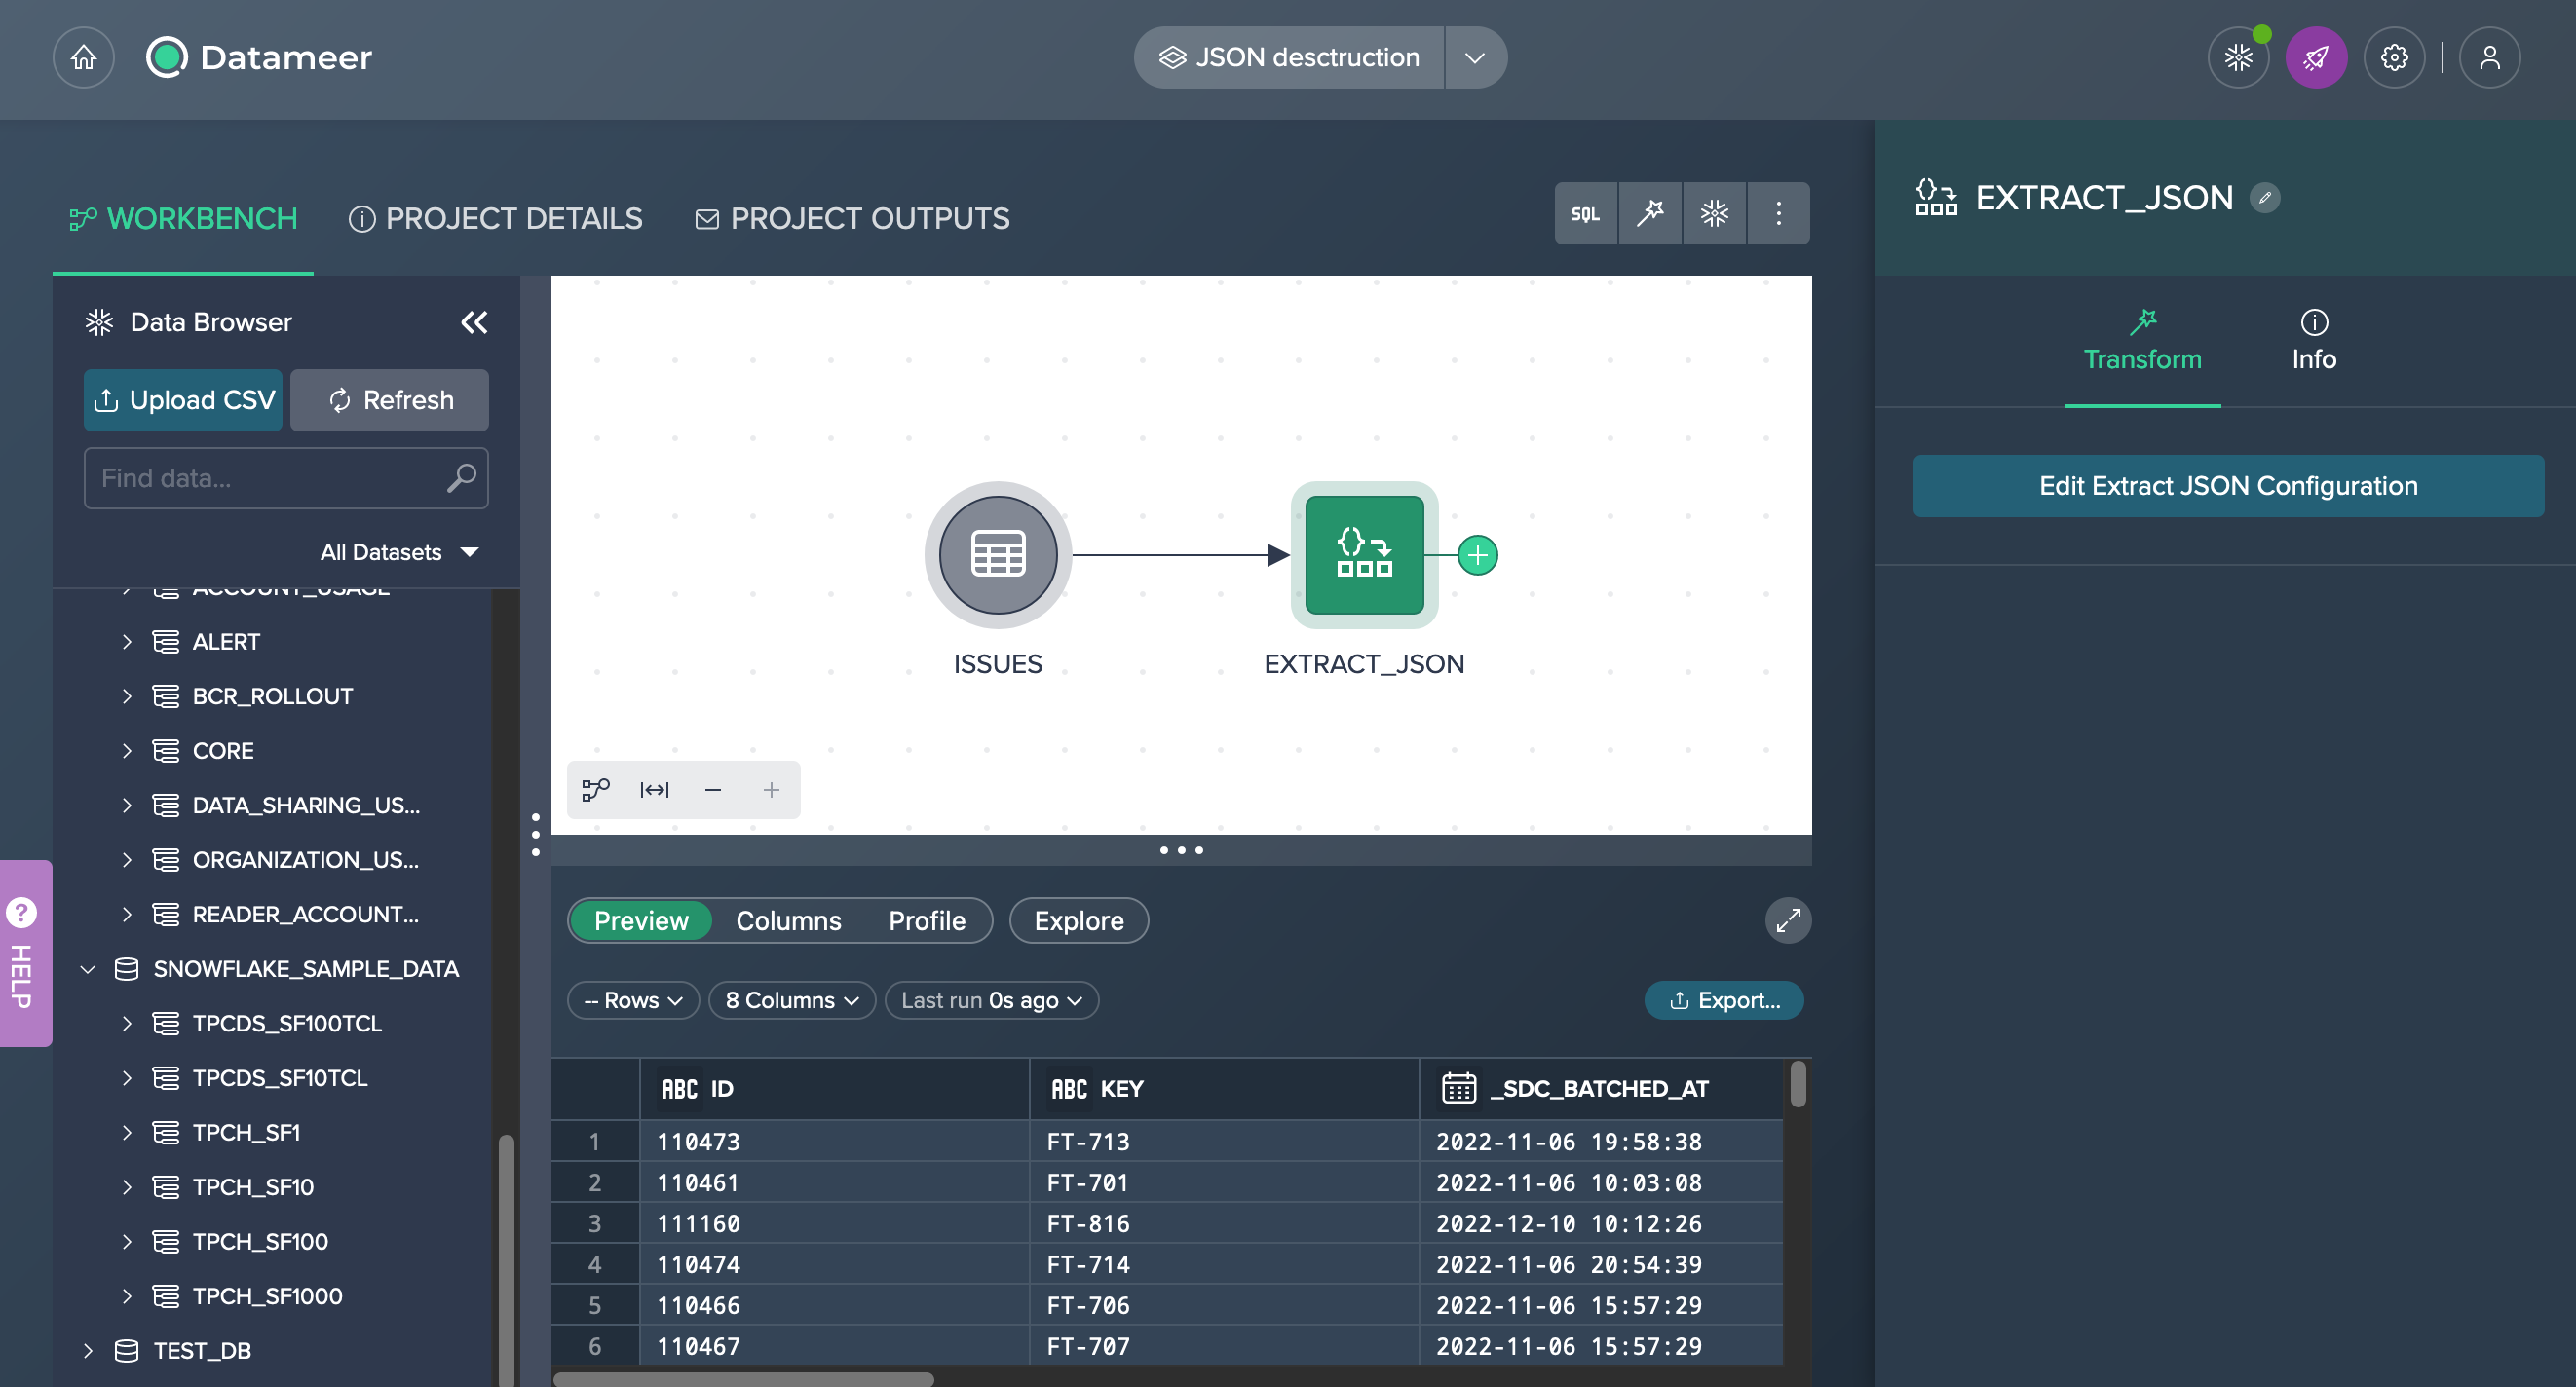
Confirm the configuration with "Apply". The configuration closes. The new extract node is displayed in the Flow Area.
Filter#
Use this operation to filter the columns in your dataset based on their content.
The following applies:
- filter operations can include a single filter condition or multiple conditions
- each filter condition runs against a single column and requires you to select one of the available operators (Equals, Not Equals, Contains, Does Not Contain, Starts With, Does Not Start With, Ends With, Does Not End With, Is Empty, Is Not Empty, In, Not In) and provide a value to filter against
- values are case sensitive and do not accept wildcards or regular expressions
- the filter operation can also be added by right-clicking on a column in the data preview area and selecting "filter" from the context menu; in that case, the column will be preselected in the filter operation dialog
- to add another condition, select a column from the list, this can be any column, even one you have previously used in this operation.
- if you configure multiple filter conditions, the resulting dataset will contain rows that satisfy all those criteria (e.g. "criteria_1 AND criteria_2").
To apply the filter operation:
-
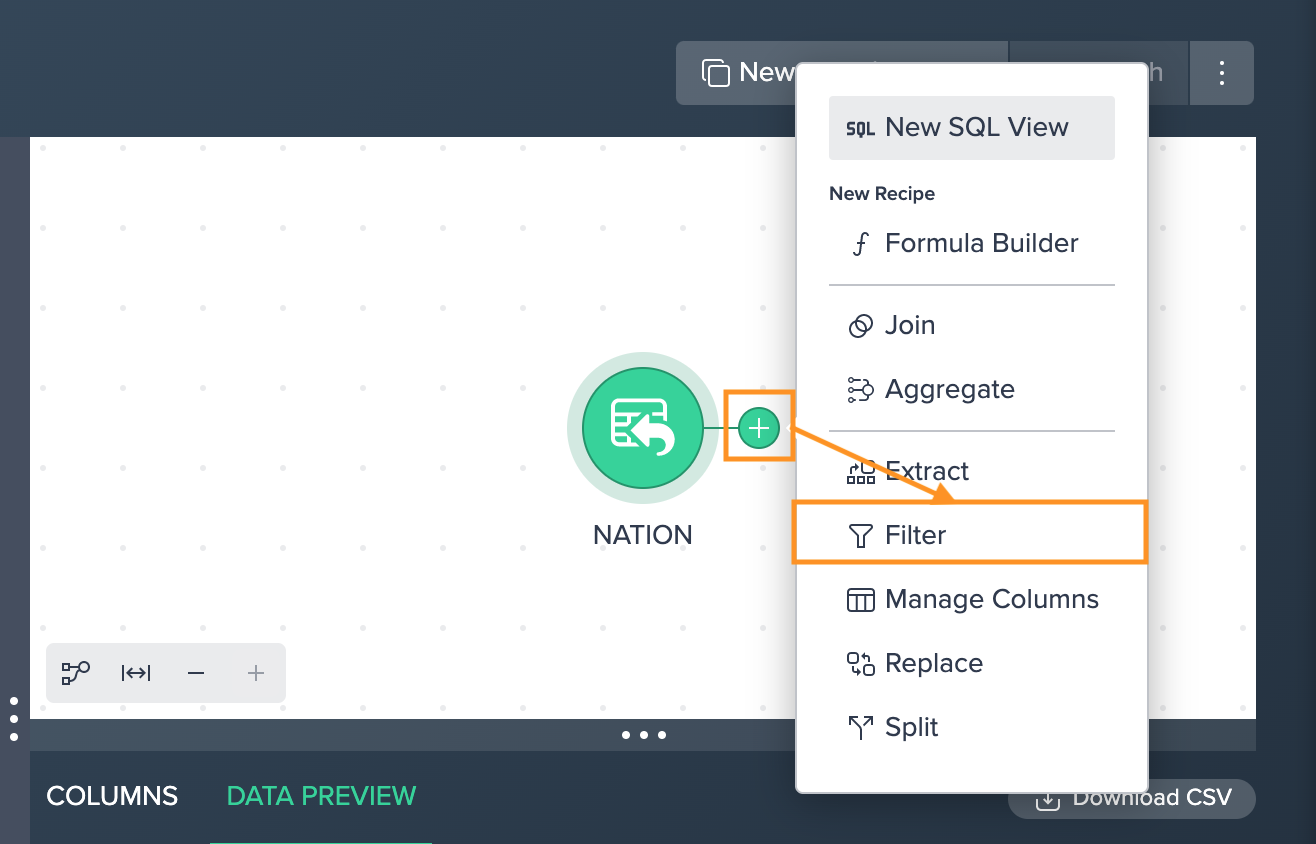
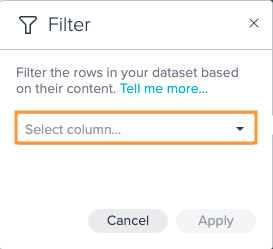
Click on the "+" next to a dataset and select "Filter". The operations configuration opens.
-
Select the column you want to apply the filter on from the drop-down.
-
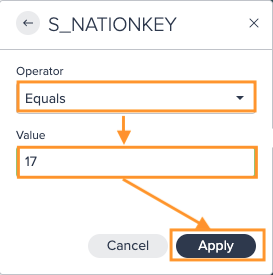
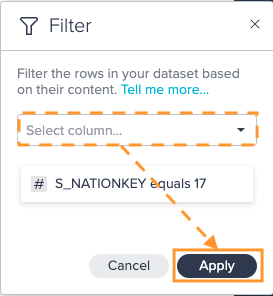
Select the "Operator" from the drop-down, enter the filter "Value" and confirm with "Apply". The filter is displayed.
-
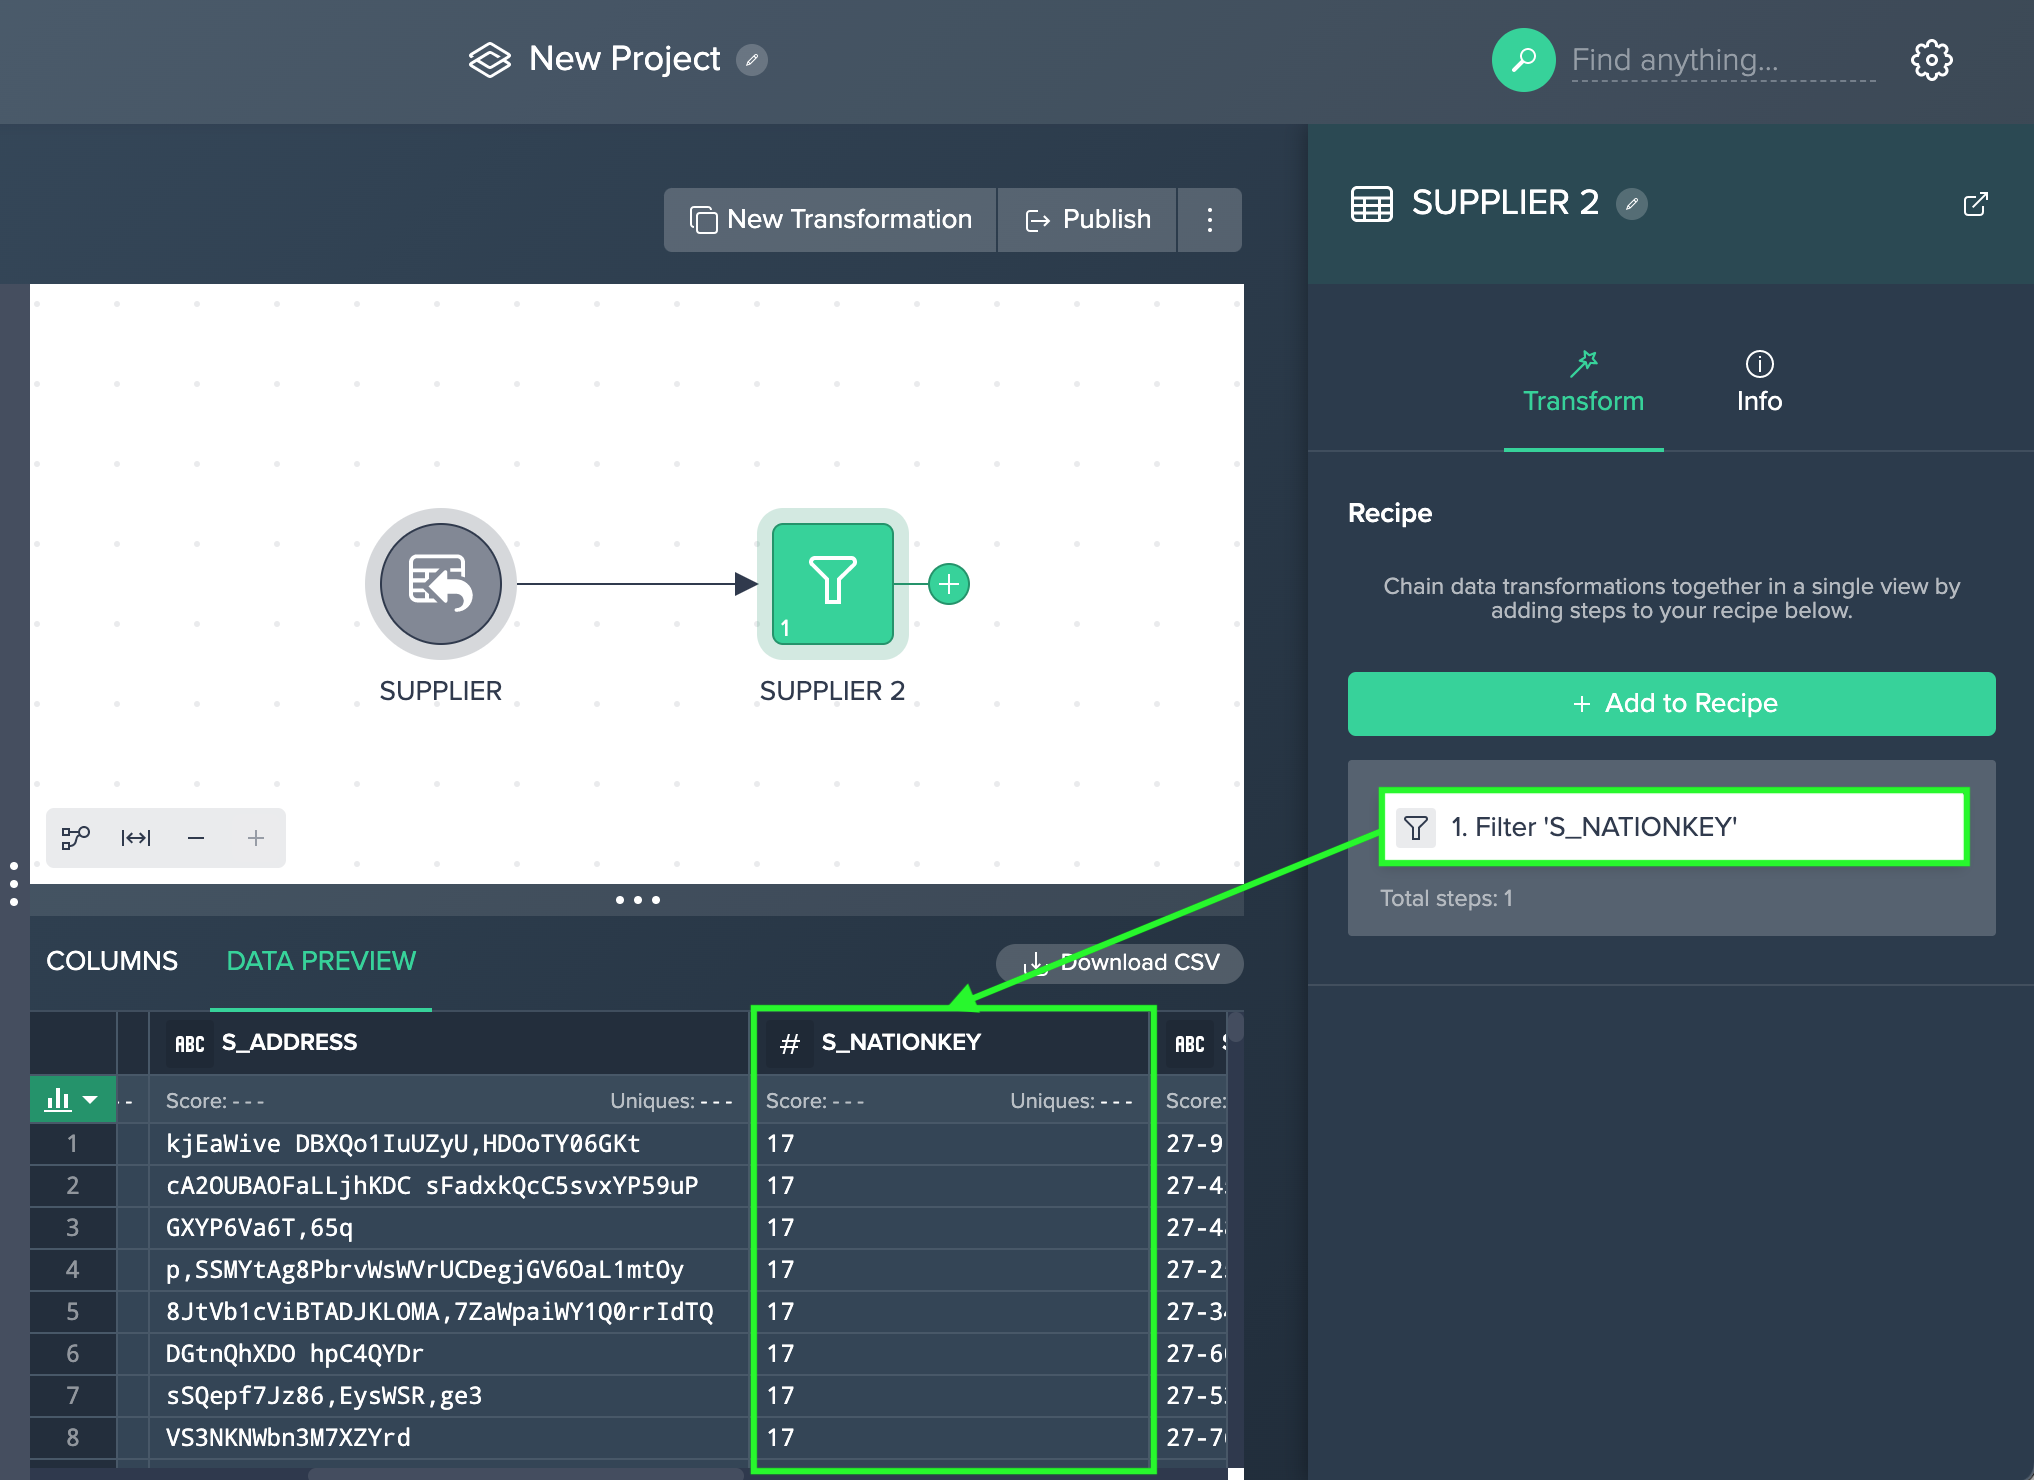
(If needed, add another filter operation and) Confirm with "Apply". All configured filter operations apply. The column view is updated. The applied operation is listed in the 'Recipe' list
Examples
Using the following data:
| Name | Type |
|---|---|
| Tom | horse |
| Ginger | dog |
| Max | cat |
| Kiki | cat |
A filter on the Type column for Not Equals and cat would result in a dataset containing only:
| Name | Type |
|---|---|
| Tom | horse |
| Ginger | dog |
A filter on the Name column for Contains and i would result in a dataset containing only:
| Name | Type |
|---|---|
| Ginger | dog |
| Kiki | cat |
Combining both filters would result in a dataset containing only:
| Name | Type |
|---|---|
| Ginger | dog |
Replace#
Use this basic search and replace operation to create a modified copy of an existing column.
The following applies:
- search and replace is case sensitive but does not accept wild cards or regular expressions
- the name for the newly created column can be set
- by default this name will be the name of your source column with "_replace" added to the end.
If you need to search for a string containing spaces, escape them in the 'Current Value' field with a \. You do not need to escape spaces in your replacement text.
To search and replace:
-
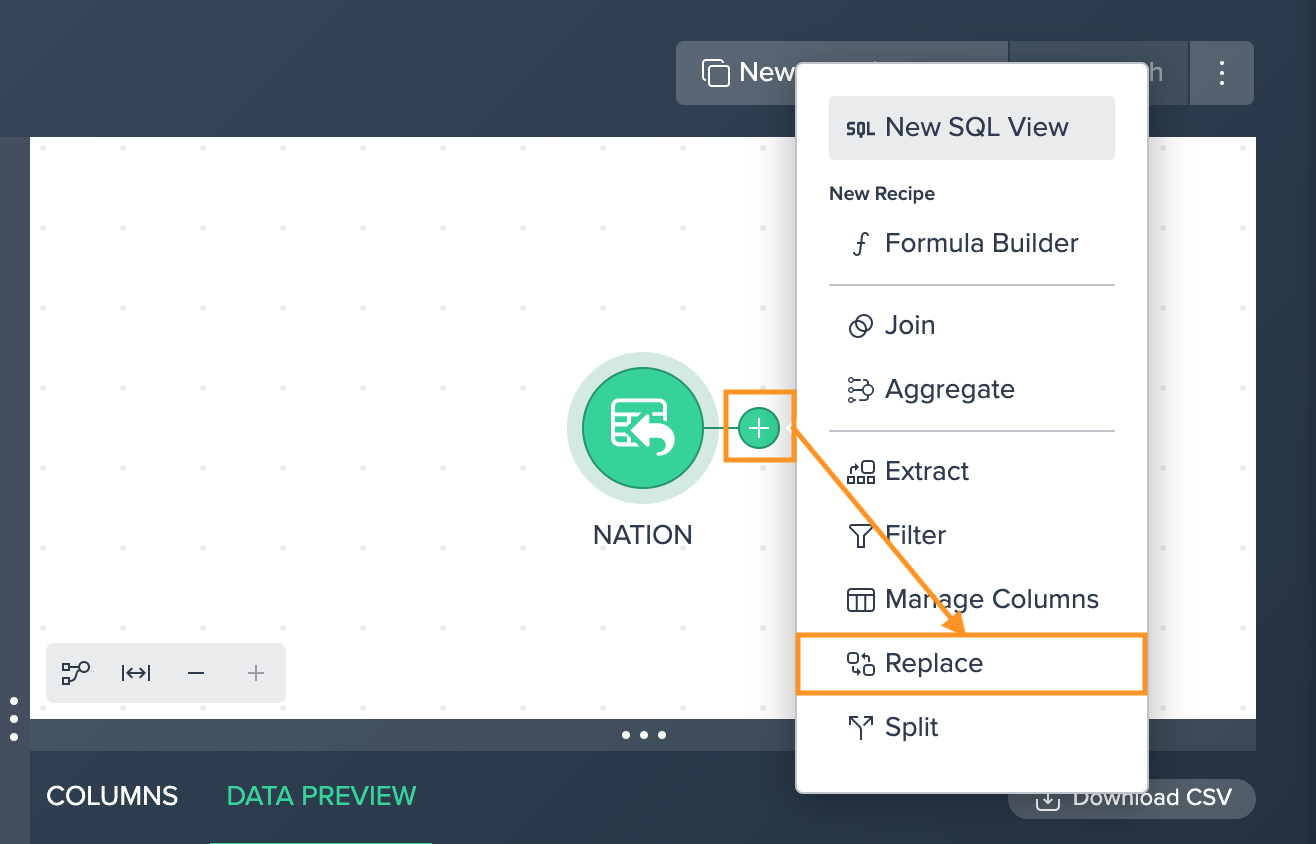
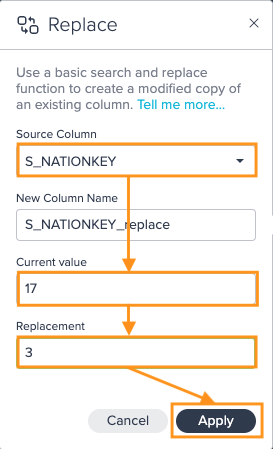
Click on the "+" next to a dataset and select "Replace". The operations configuration opens.
-
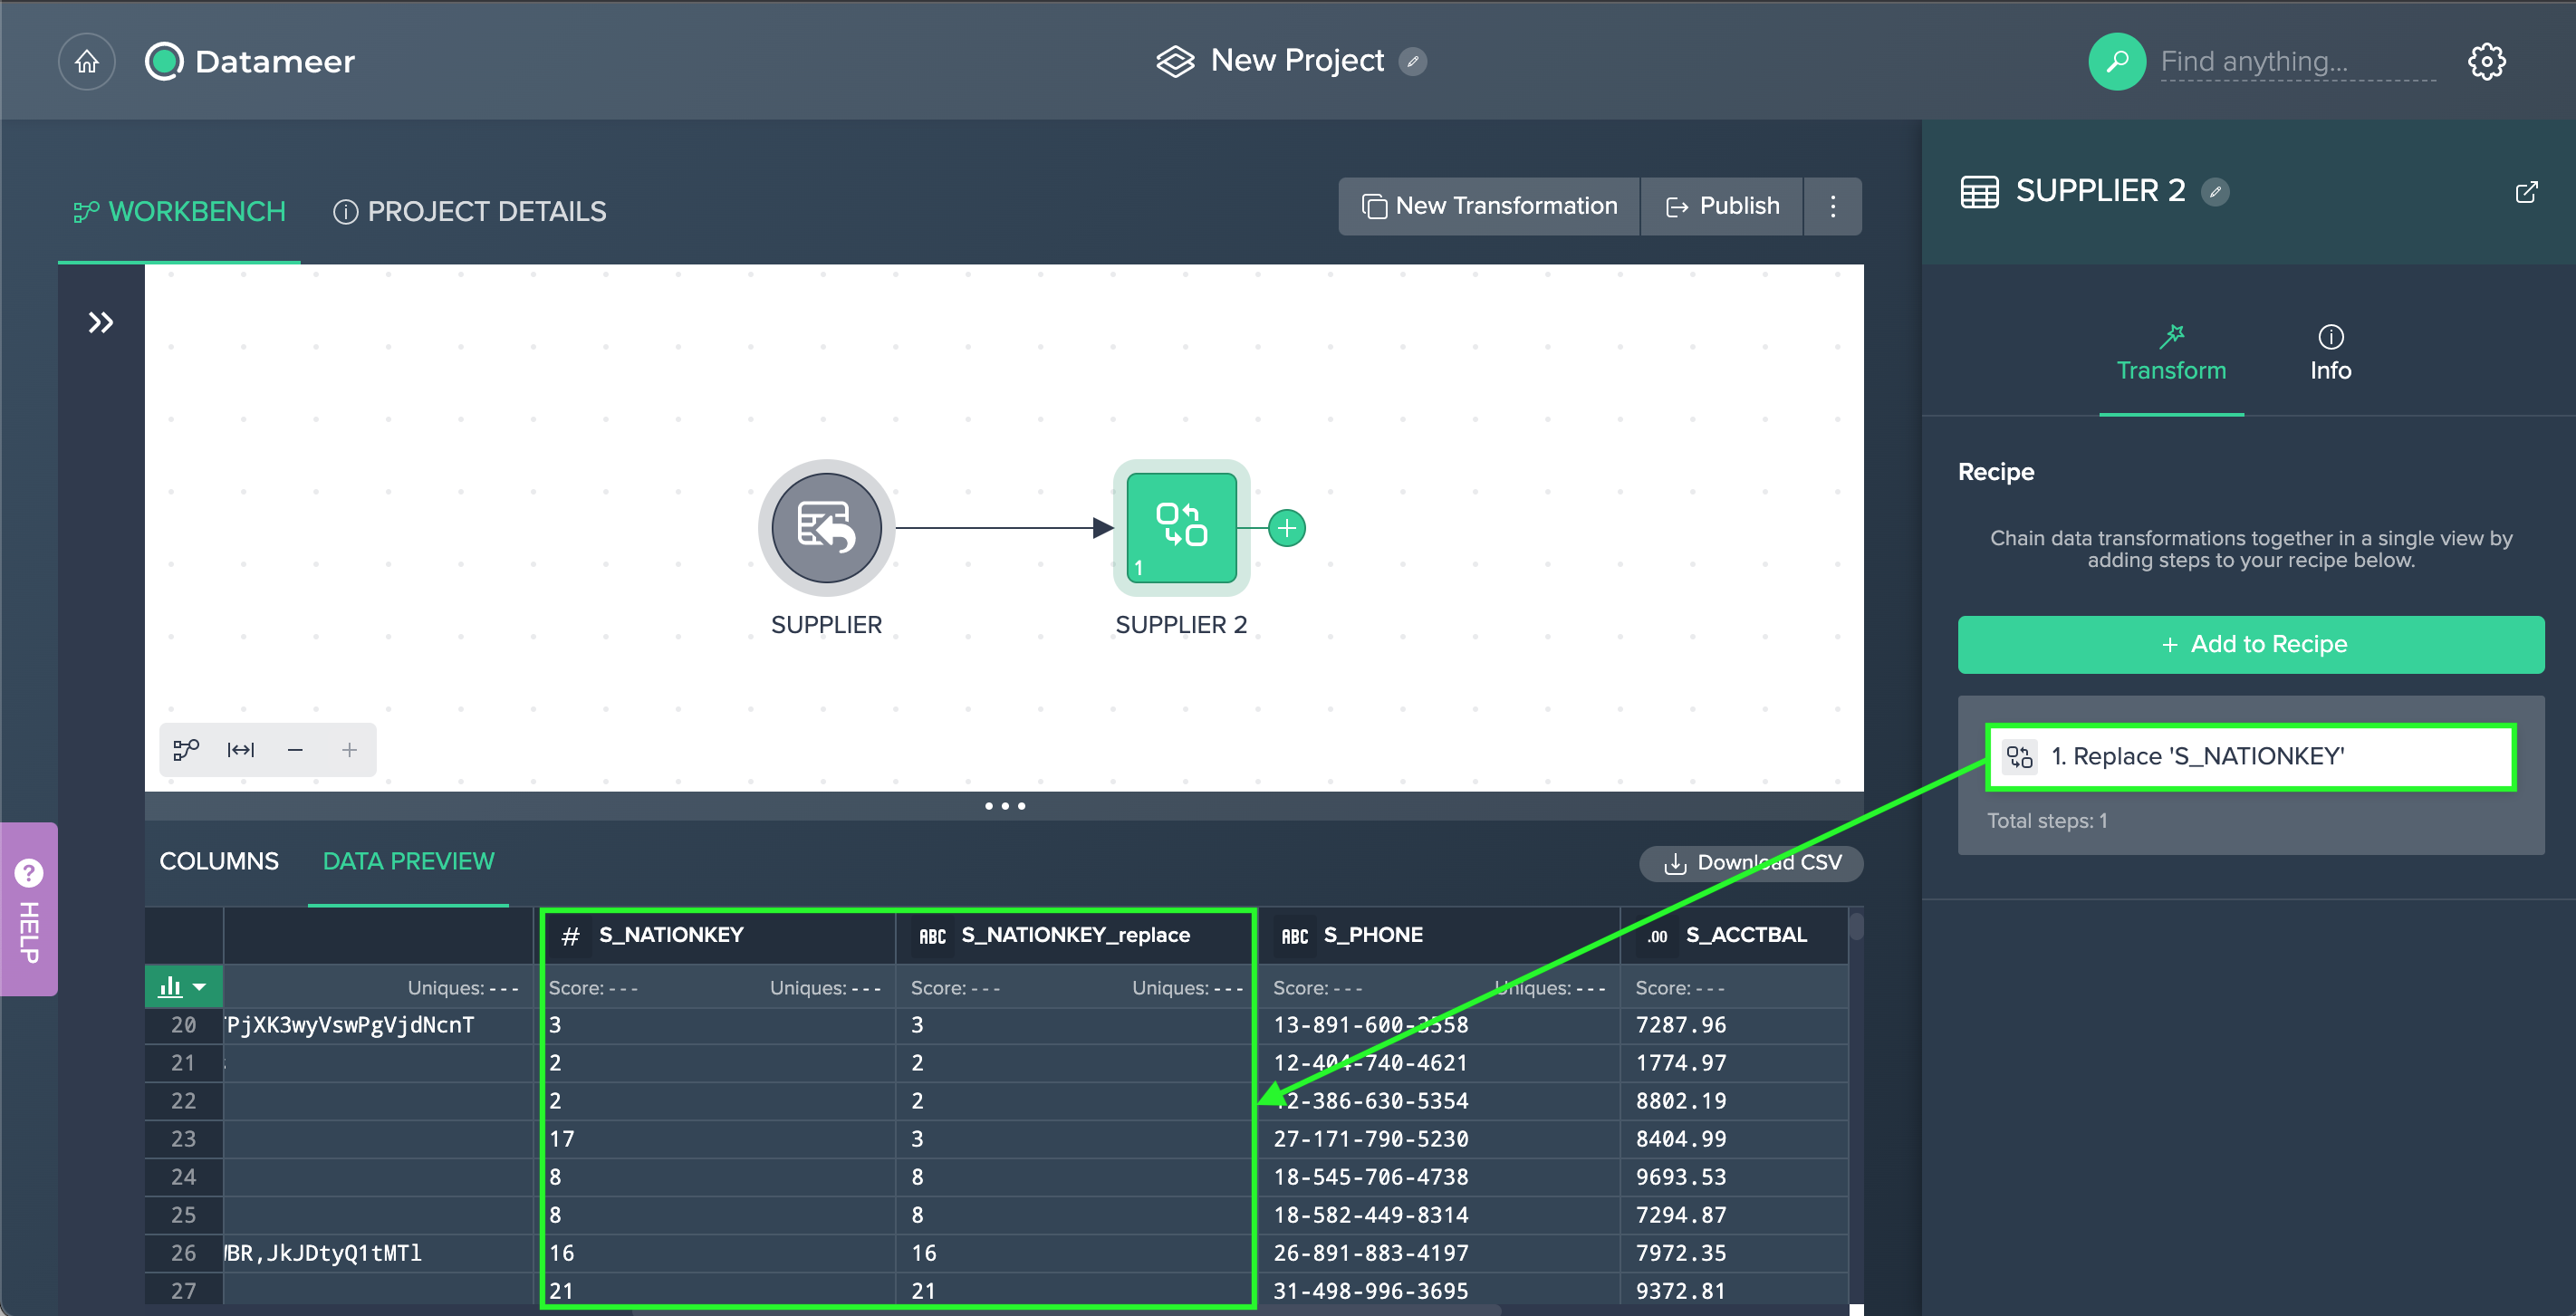
Select the "Source Column", enter the "Current value" and the "Replacement" value, and confirm with "Apply". The configuration applies. The column view is updated. The applied operation is listed in the 'Recipe' list
Example
Searching for "m" and replacing it with "M" would transform:
| Title |
|---|
| Ms. |
| mr. |
| Dr. |
into:
| Title | Title_replace |
|---|---|
| Ms. | Ms. |
| mr. | Mr. |
| Dr. | Dr. |
Split#
Use this operation to copy one column into two or more columns broken up by a pattern you specify.
The following applies:
- the split operation can also be added by right-clicking on a column in the data preview area and selecting "Split" from the context menu
- in that case, the column will be preselected in the split operation dialog
- the pattern for your delimiter is case sensitive but does not accept wildcards
- regular expressions are supported if you check the 'Regular Expression' box underneath the delimiter text entry box
- you can enter a custom name for newly created columns or accept the default, which is the the source column name appended with '_split'; each new column name, whether custom or default, is sequentially appended with a number, from 1 to the column limit
- if your data contains multiple instances of the delimiter, you may want to increase the column 'Limit', which controls how many columns will be created; the default 'Limit' is 2, which is also the minimum, any elements from your original column beyond the column 'Limit' you specify will be dropped; if you set a higher 'Limit' than there are occurrences of your delimiter in the data, empty columns will be created.
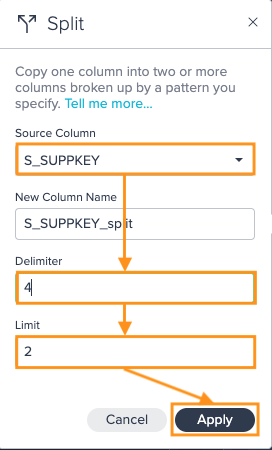
To split a column:
-
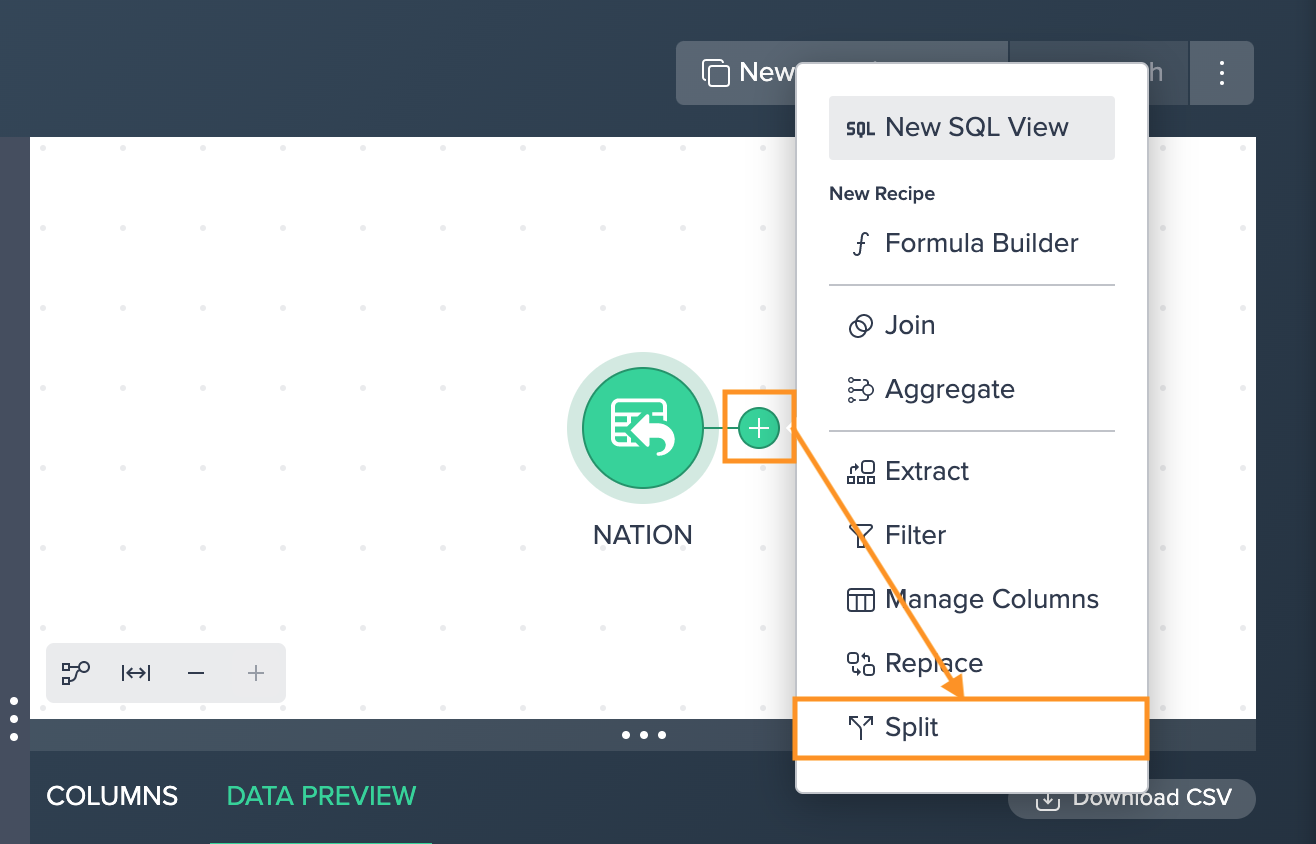
Click on the "+" next to a dataset and select "Split". The operations configuration opens.
-
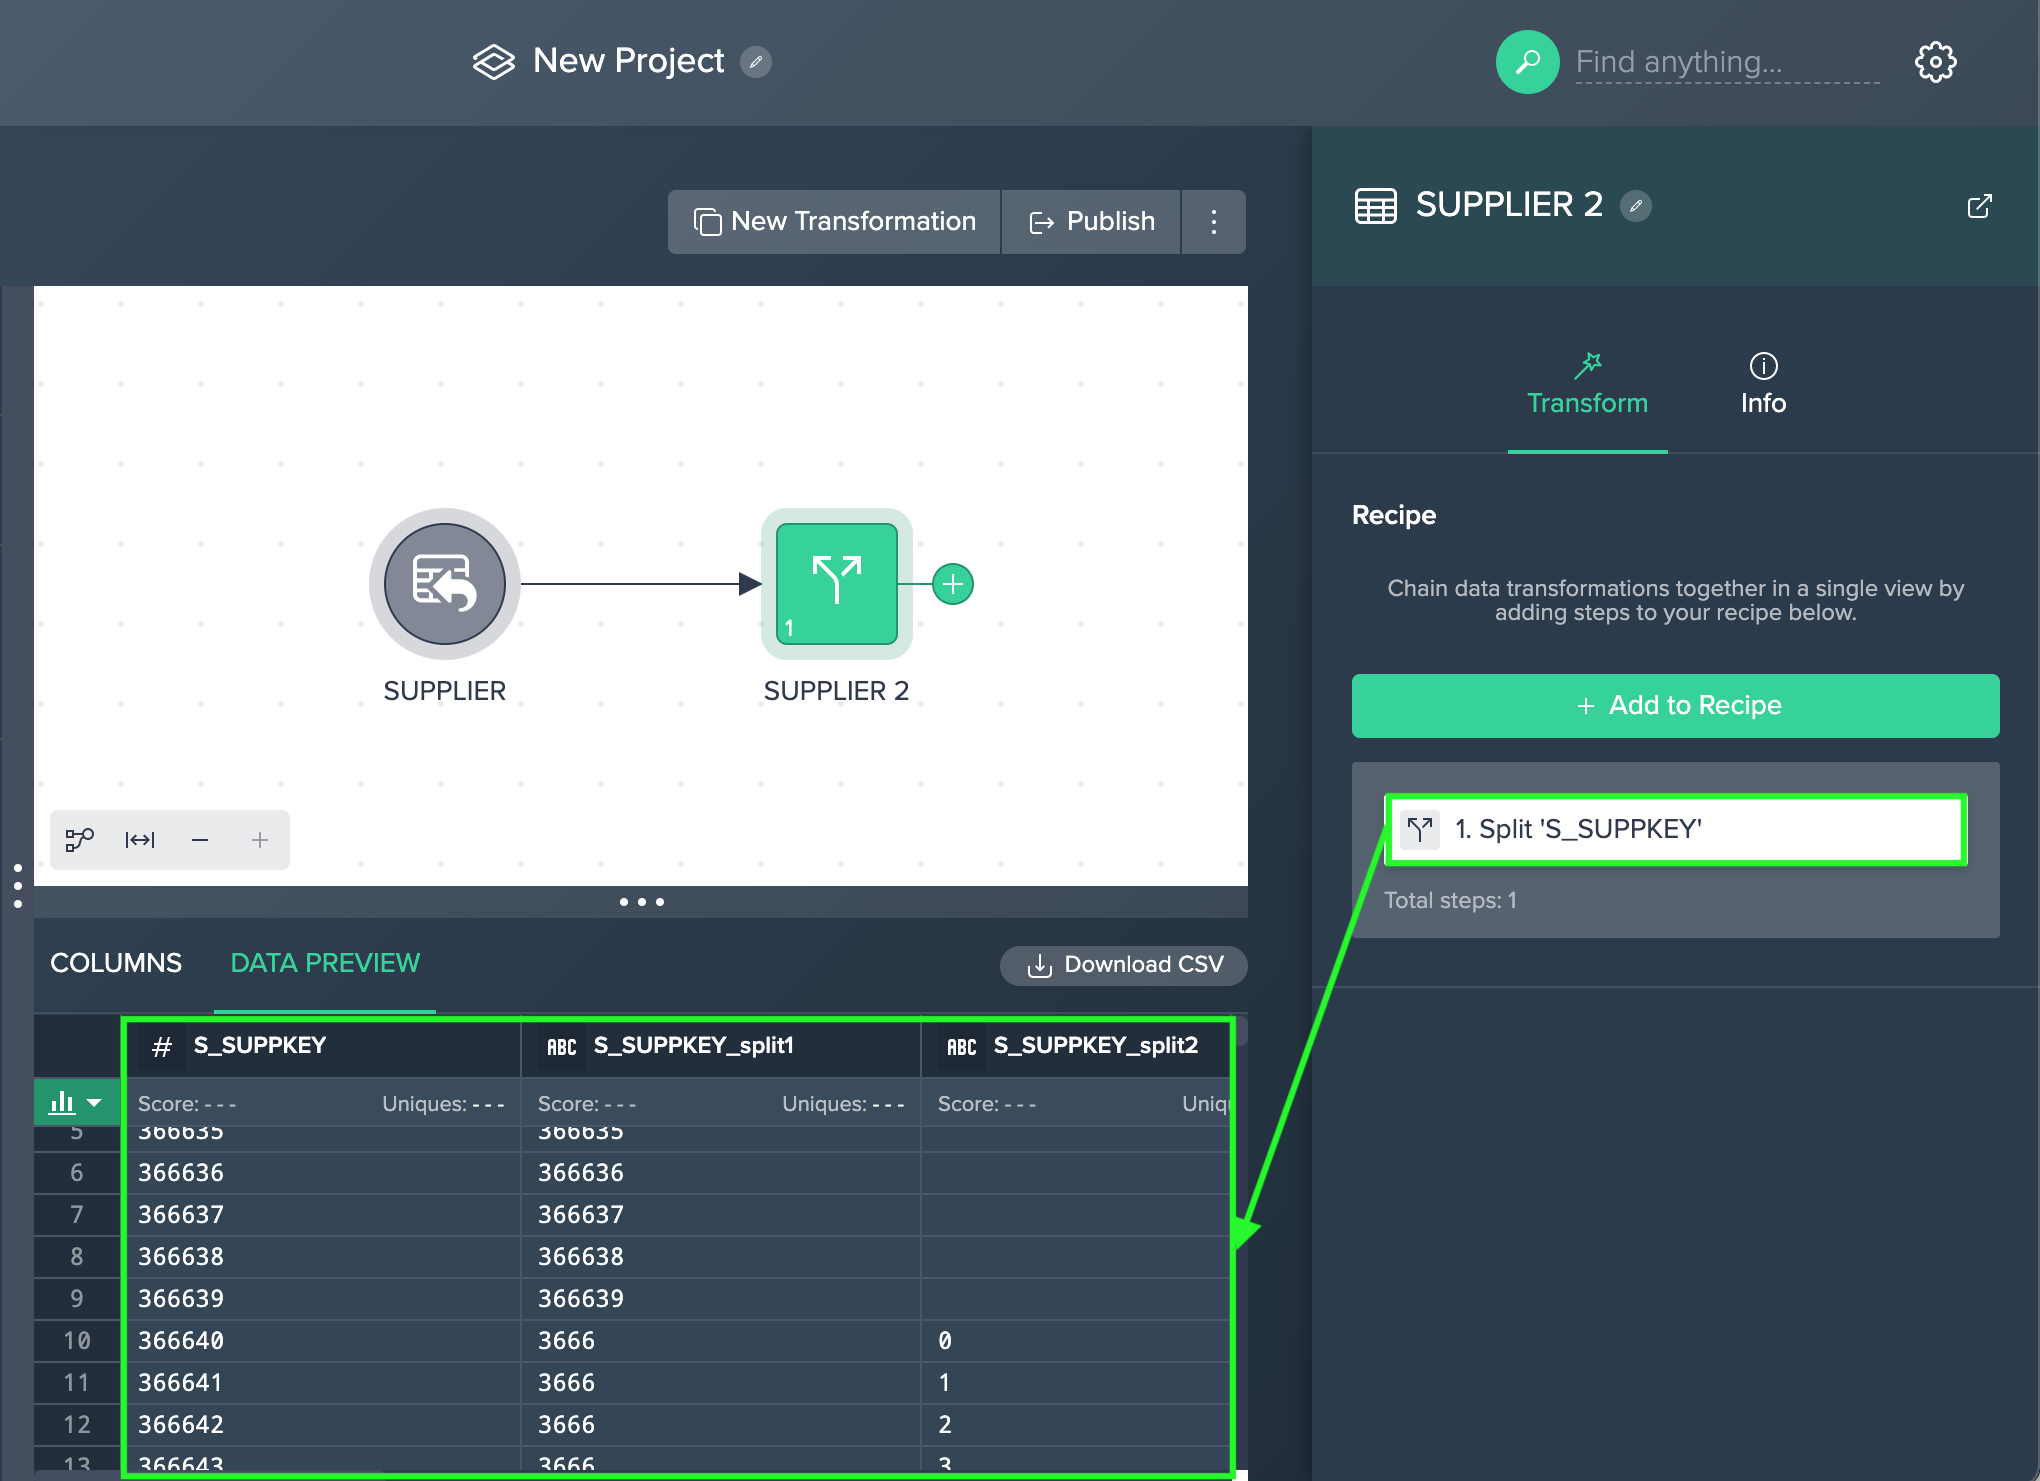
Select the "Source Column", enter the "Delimiter", enter the "Limit", and confirm with "Apply". The configuration applies. The column view is updated. The applied operation is listed in the 'Recipe' list
Example
Using this data and a new column name of "IP_Address_Octet":
| Address |
|---|
| 172.54.1.234 |
| 172.224.56.2 |
Splitting on the . delimiter with the default 'Limit' of 2 produces:
| Address | IP_Address_Octet1 | IP_Address_Octet2 |
|---|---|---|
| 172.54.1.234 | 172 | 54 |
| 172.224.56.2 | 172 | 224 |
Splitting on the . delimiter with a 'Limit' of 5 produces:
| Address | IP_Address_Octet1 | IP_Address_Octet2 | IP_Address_Octet3 | IP_Address_Octet4 | IP_Address_Octet5 |
|---|---|---|---|---|---|
| 172.54.1.234 | 172 | 54 | 1 | 234 | |
| 172.224.56.2 | 172 | 224 | 56 | 2 |
Extract#
Use this operation to create a new column from a fixed slice of characters in one of your existing columns.
The following applies:
- the Start Index you enter is counted from the left and specifies how many characters to skip before starting the content of your new column, to start with the first character in your column, set the Start Index to 0
- the Length you enter is the number of characters after the start index to copy into your new column
- you can also set the name for the newly created column; by default this name will be the name of your source column with '_extract' added to the end
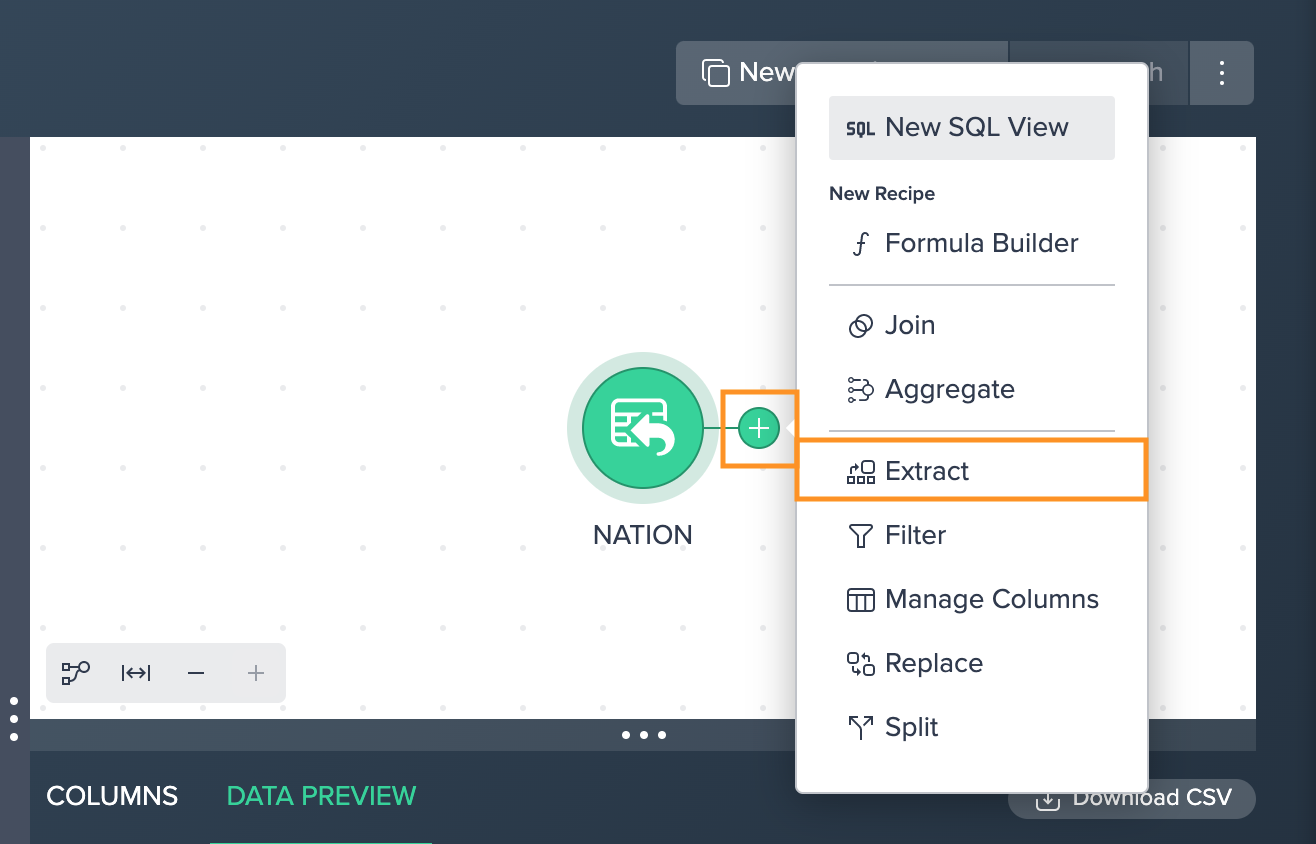
To extract:
-
Click on the "+" next to a dataset and select "Extract". The operations configuration opens.
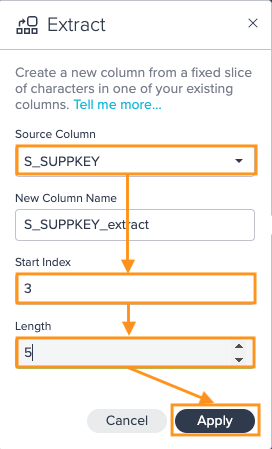
-
Select the "Source Column" from the drop-down, enter the "Start Index" and "Length", and confirm with "Apply". The configuration applies. The column view is updated. The applied operation is listed in the 'Recipe' list
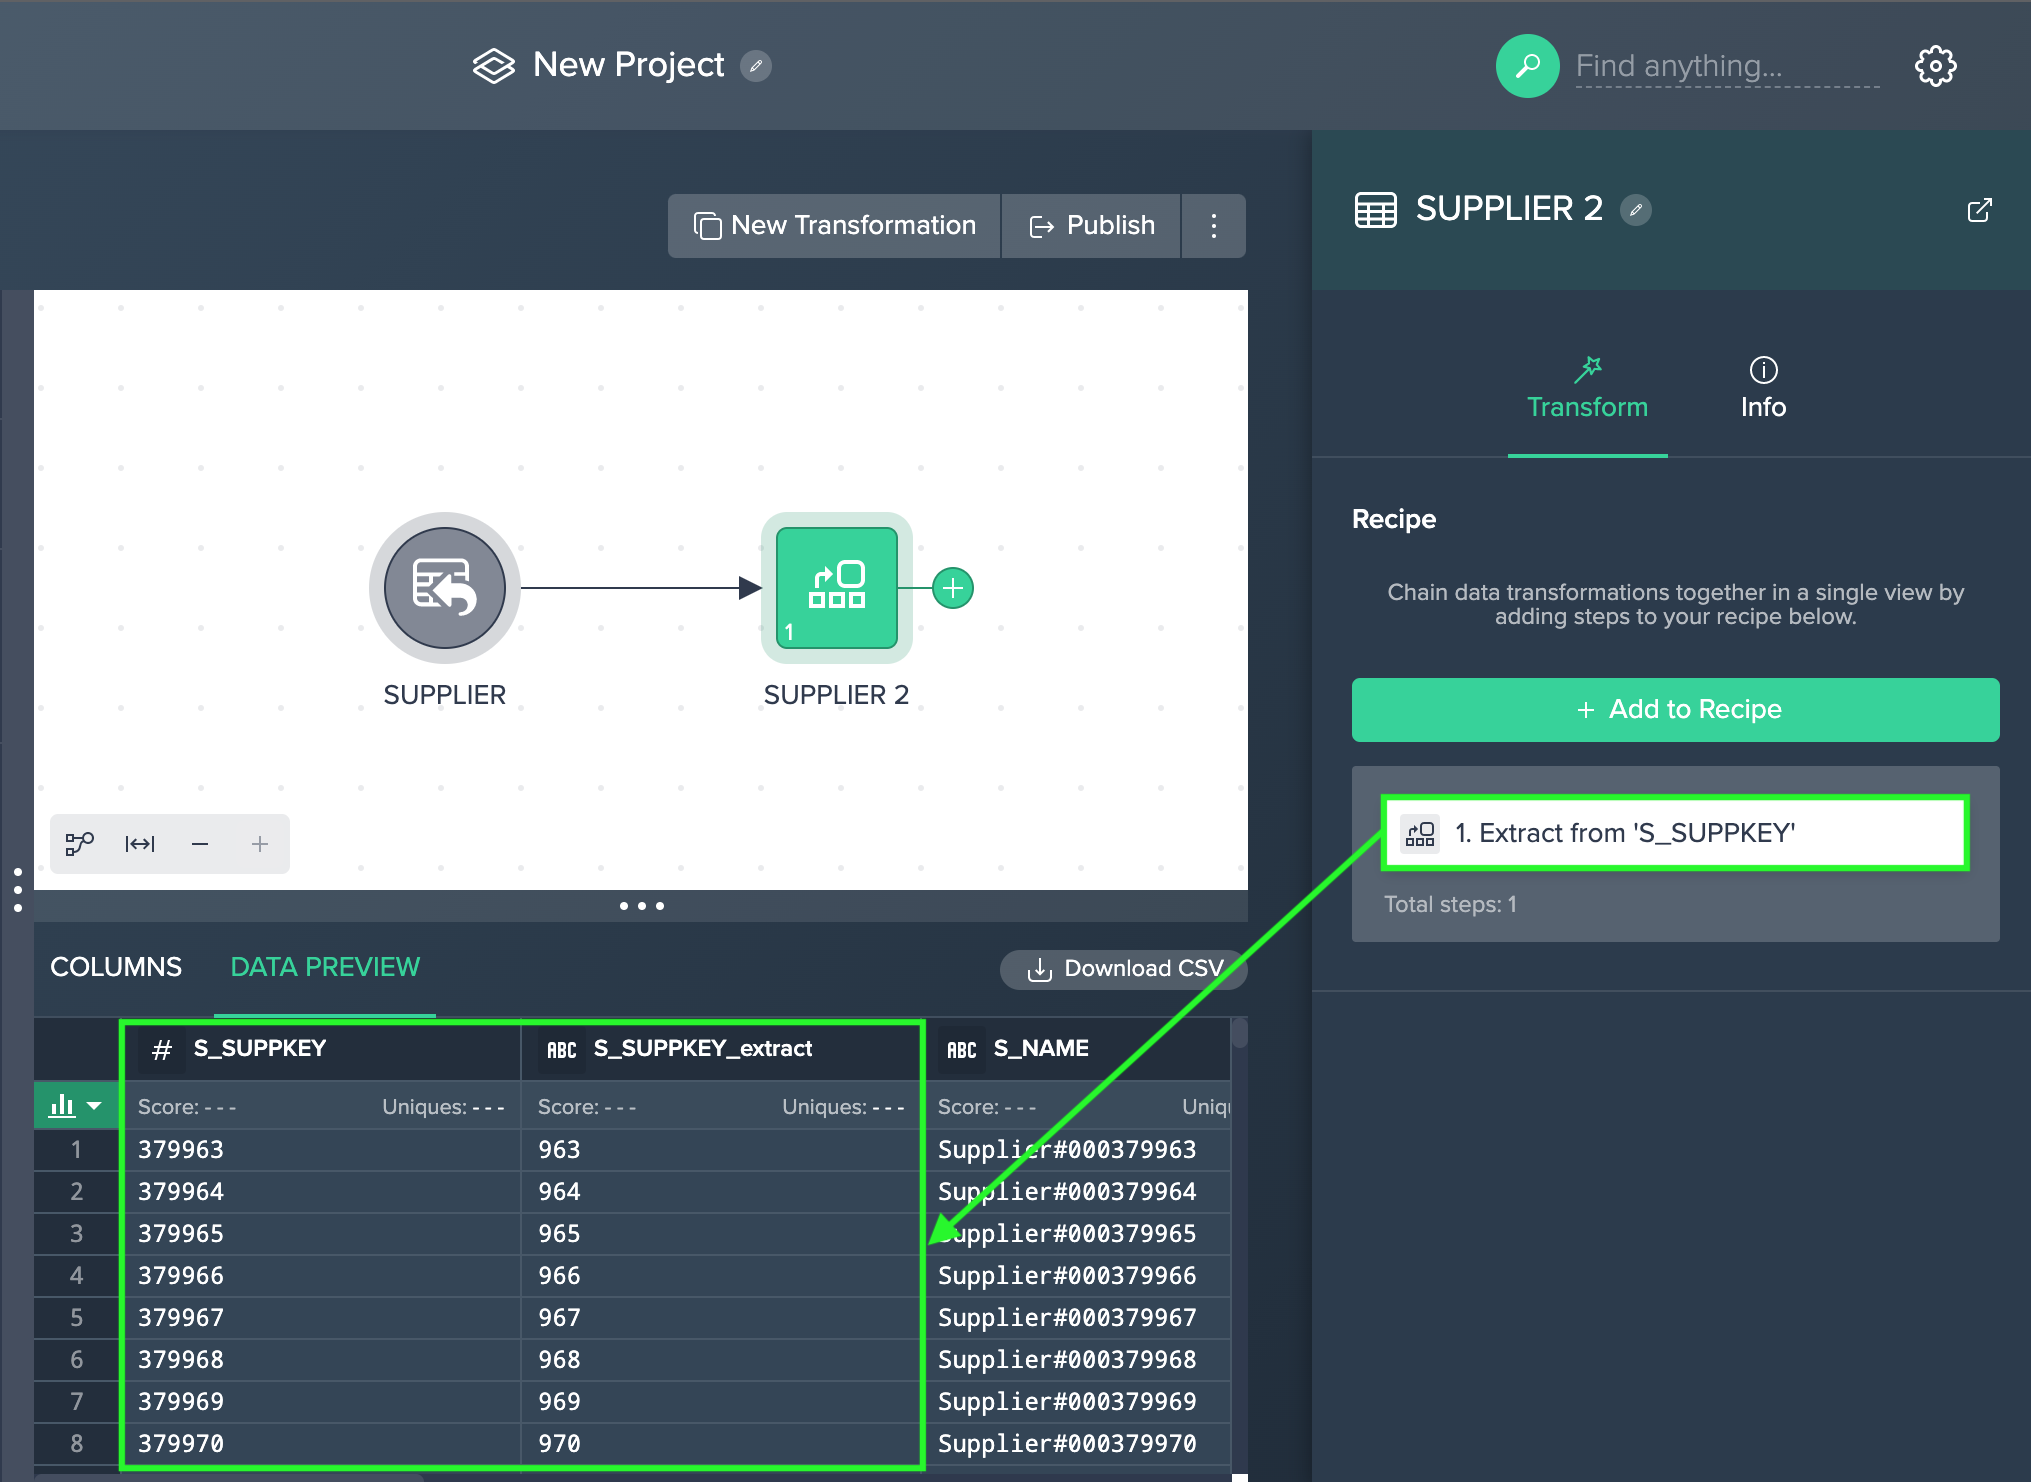
Example
Specifying a Start Index of 4, a Length of 2, and a new column name of "Month" would transform:
| Date |
|---|
| 20191208 |
| 20111130 |
into
| Date | Month |
|---|---|
| 20191208 | 12 |
| 20111130 | 11 |
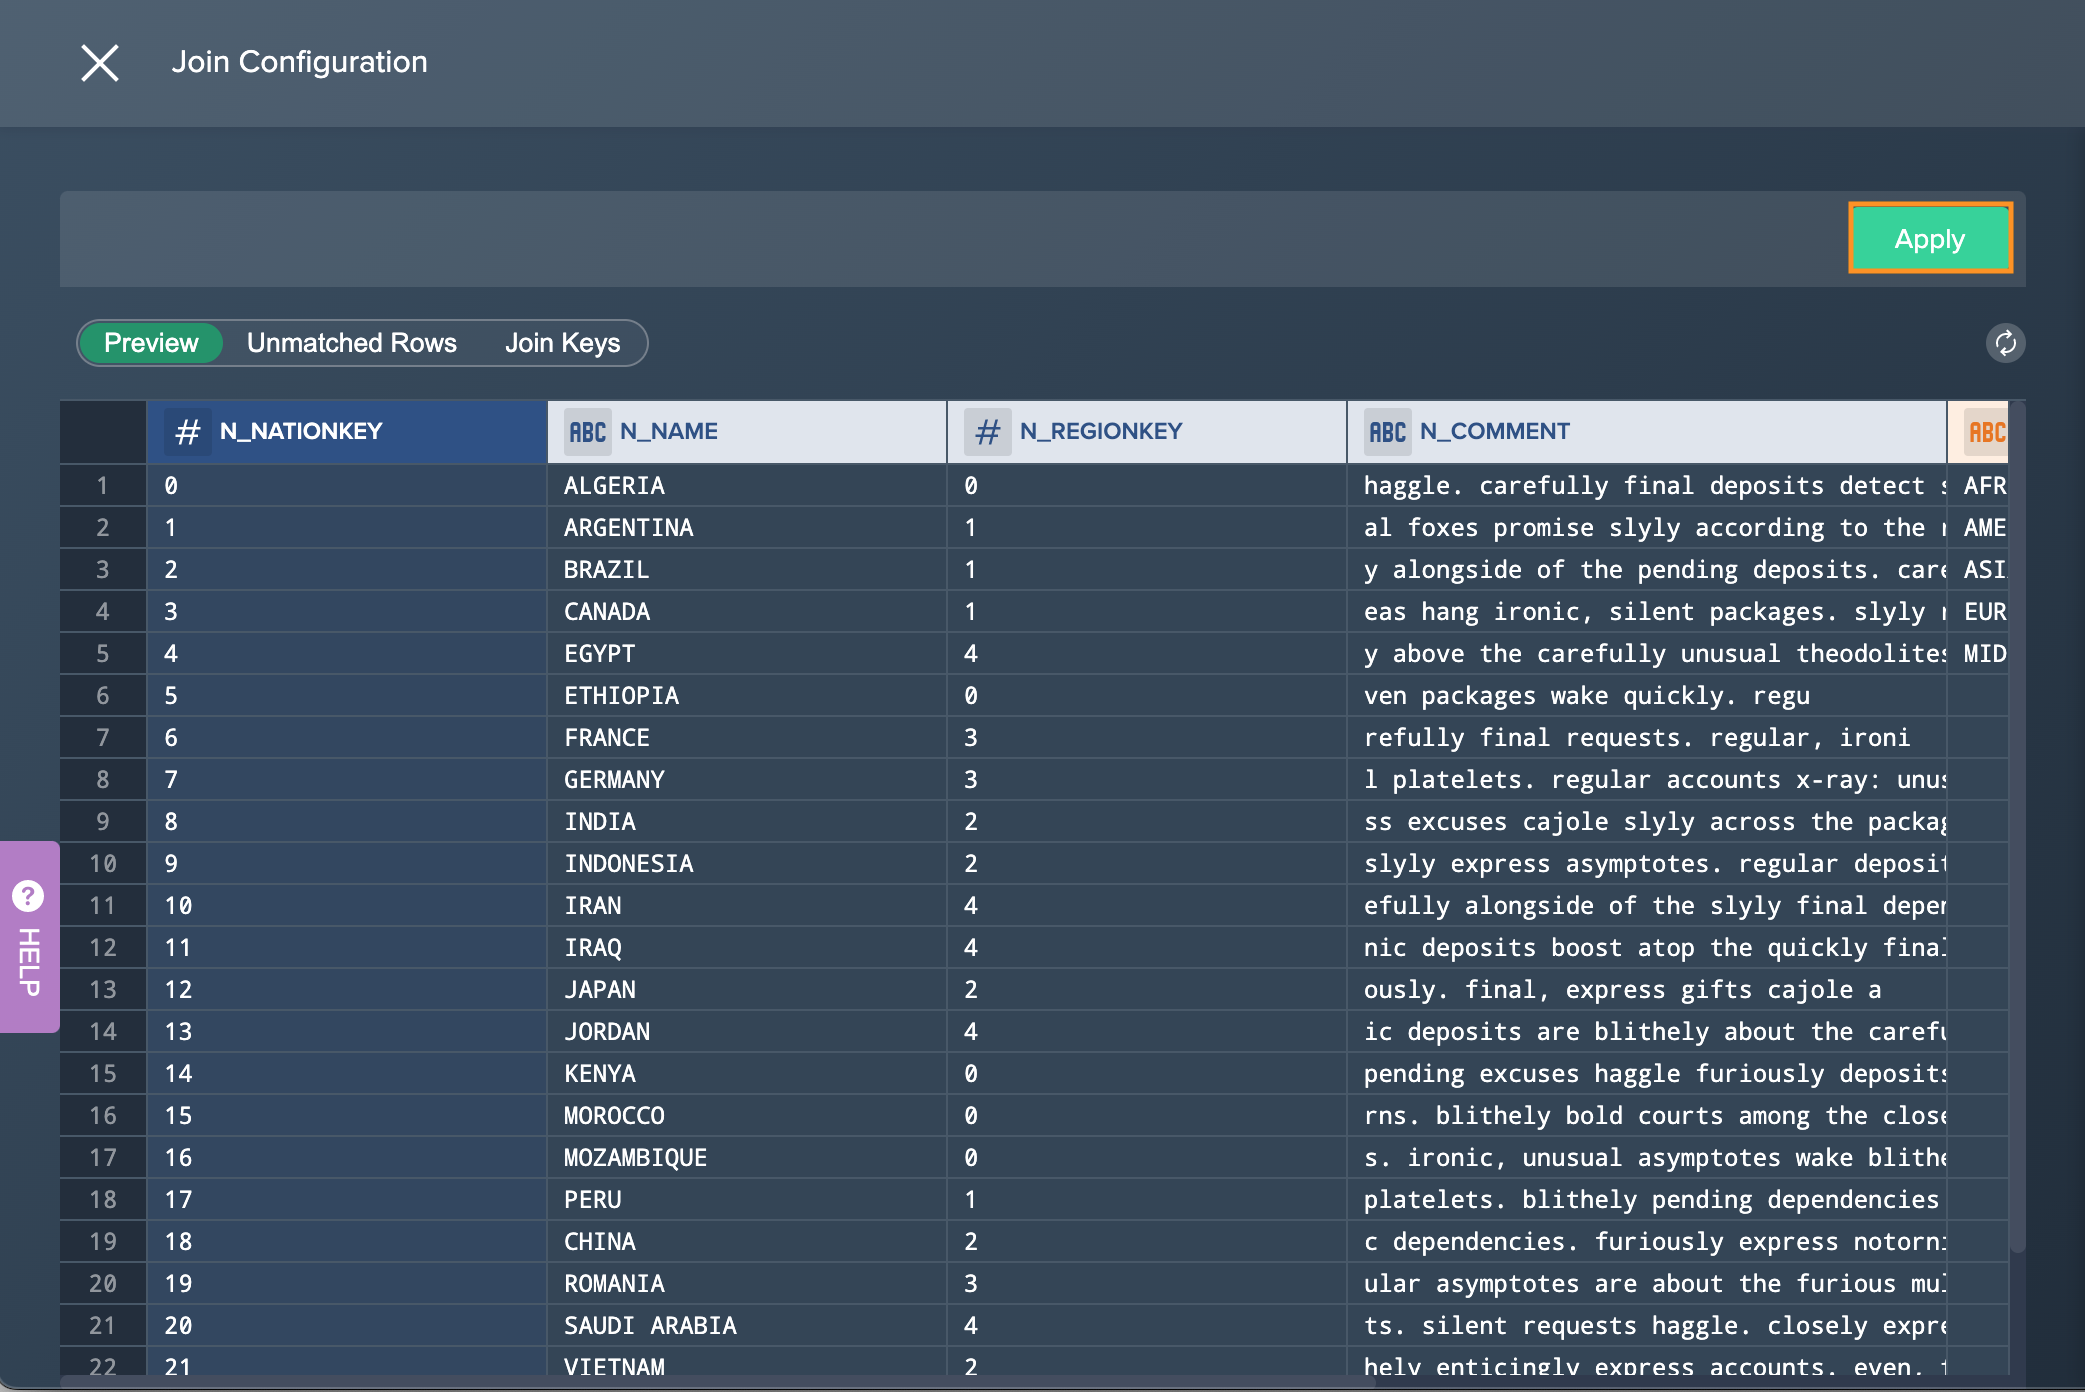
Join#
Use this operation to combine with the contents of a second dataset based on shared content in one or more columns.
The following applies:
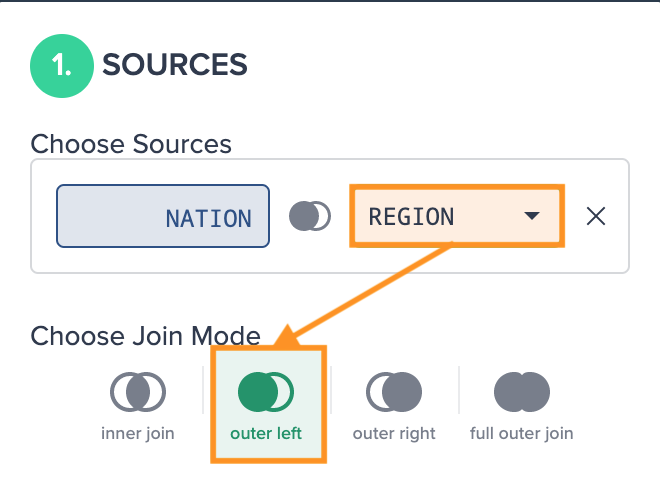
- use the 'Sources' section to select another dataset and configure how the data from the two will be combined. You can also exchange the original source in the dropdown
- by default Datameer uses an 'Outer Left' blend mode which will include all information from your starting dataset and any content from the second dataset that has an entry in the column(s) you select in the 'Columns' section - more info on these options is available at W3Schools
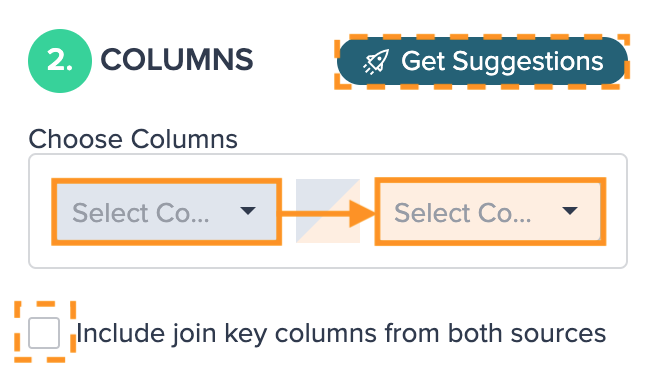
- the 'Columns' section lets you choose which columns between the two datasets overlap and should be used in combining the two datasets
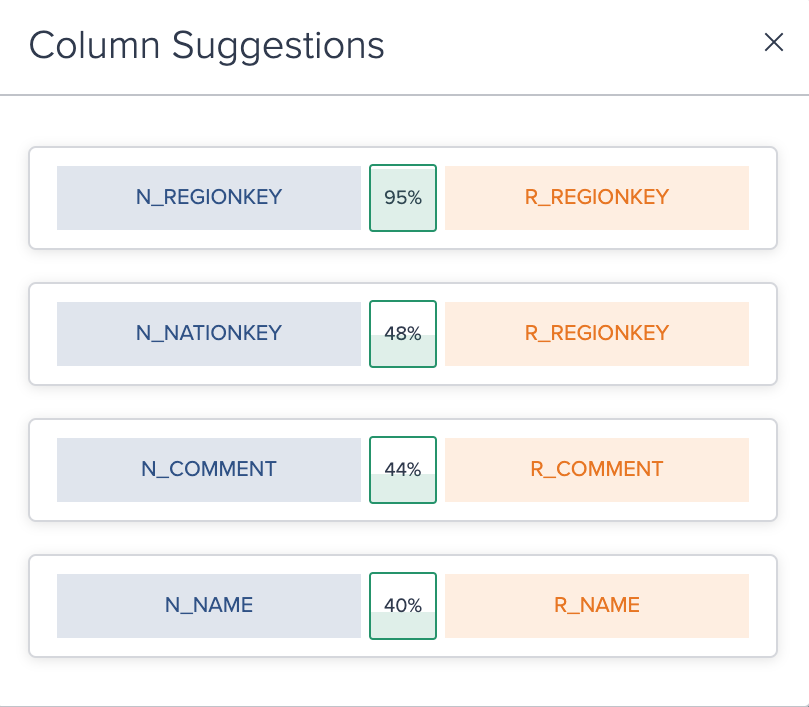
- you can select one of the column pairs Datameer suggests or configure columns manually by selecting names from the drop down menus and clicking the small "+" button to the right of these drop-down menus
- add multiple column pairings to refine your results; only rows with content that overlaps in all your specified column pairs will be used in combining the two datasets
- note that when system resources are being heavily used, Datameer may occasionally be unable to generate a preview of an operation
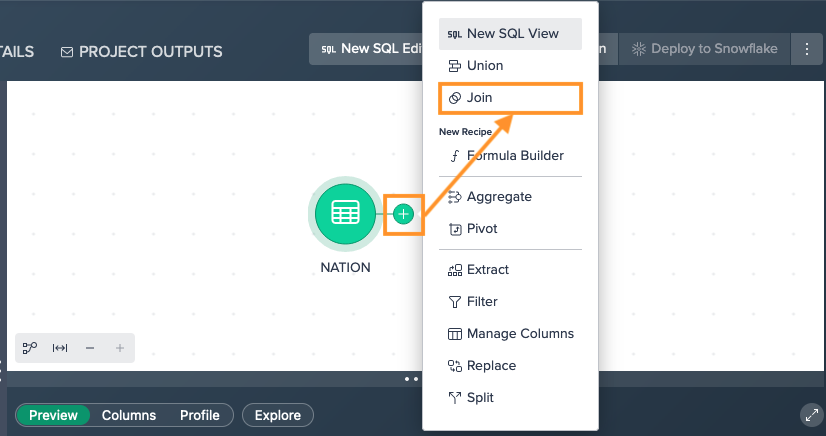
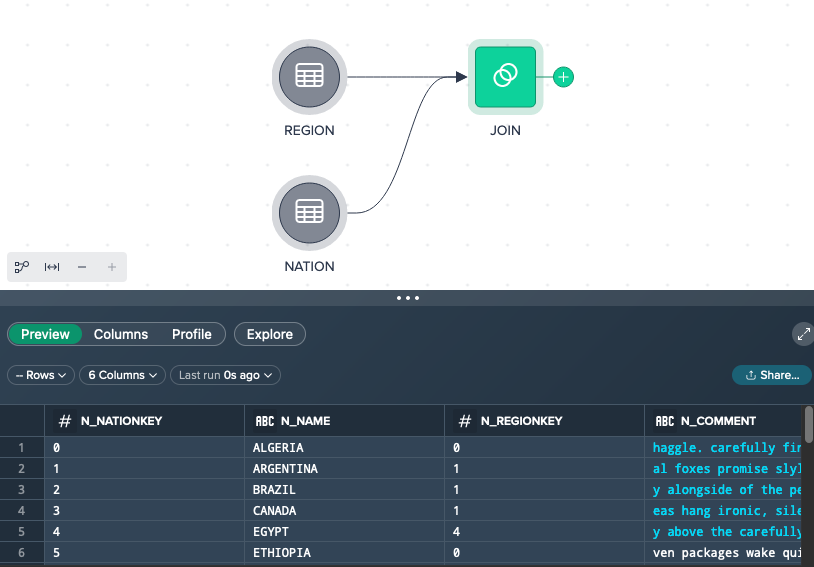
To perform a join:
-
Click on the "+" next to a dataset and select "Join". The operations configuration opens.
-
Select the second "Source" and the "Join Mode". The column preview on the left adapts.
-
Select the columns from the dropdown. If needed, mark the checkbox for including the join key columns from both sources. If needed, click on "Get Suggestions" to display suggested join columns. A dialog will pop up then.
-
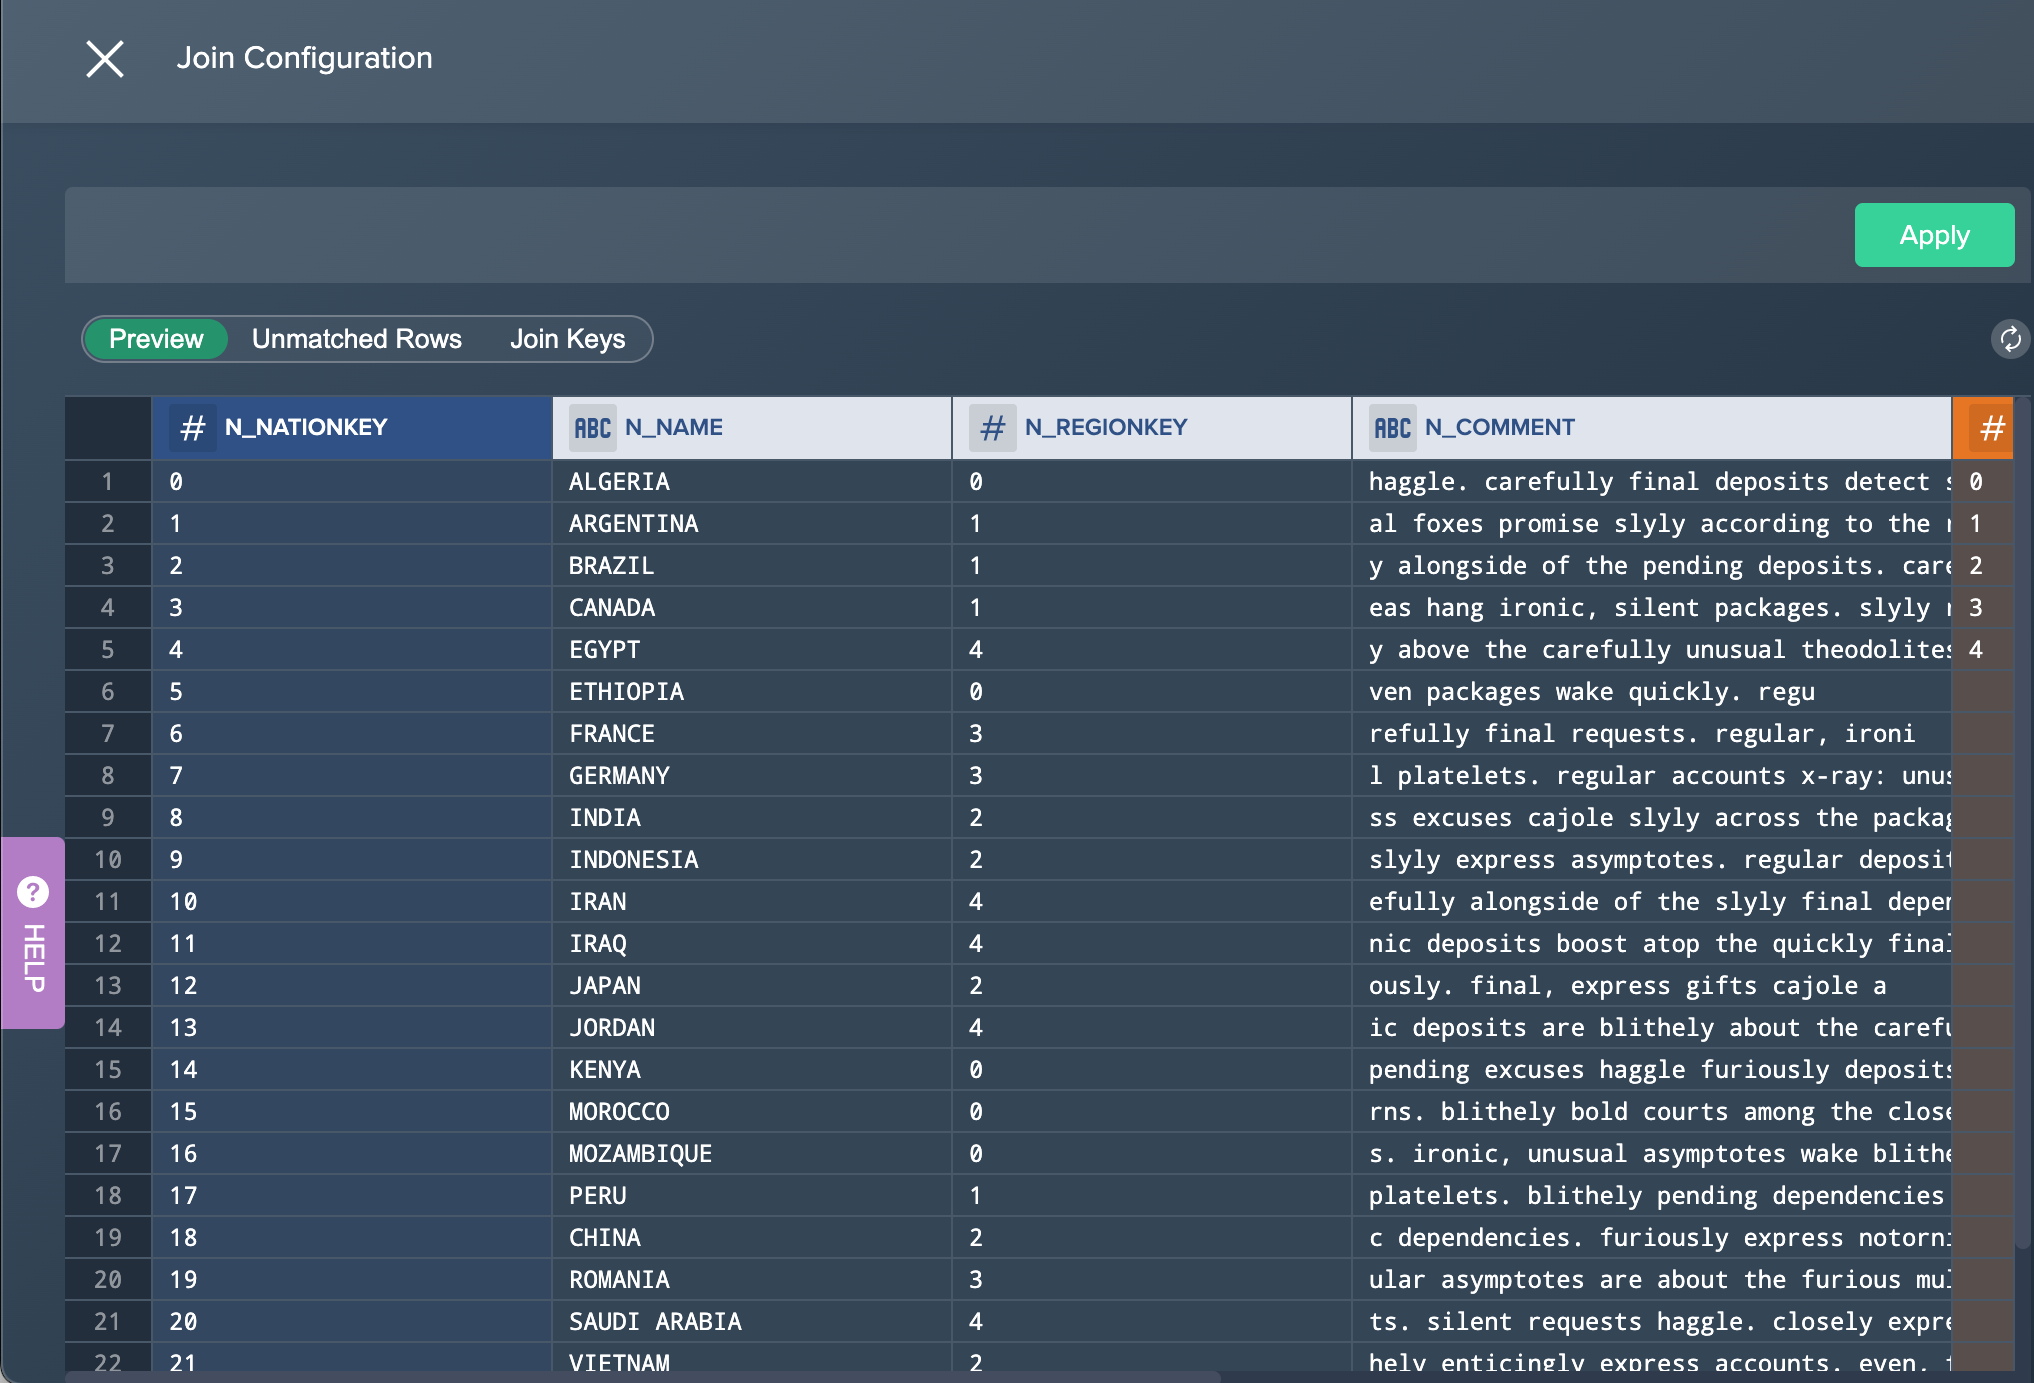
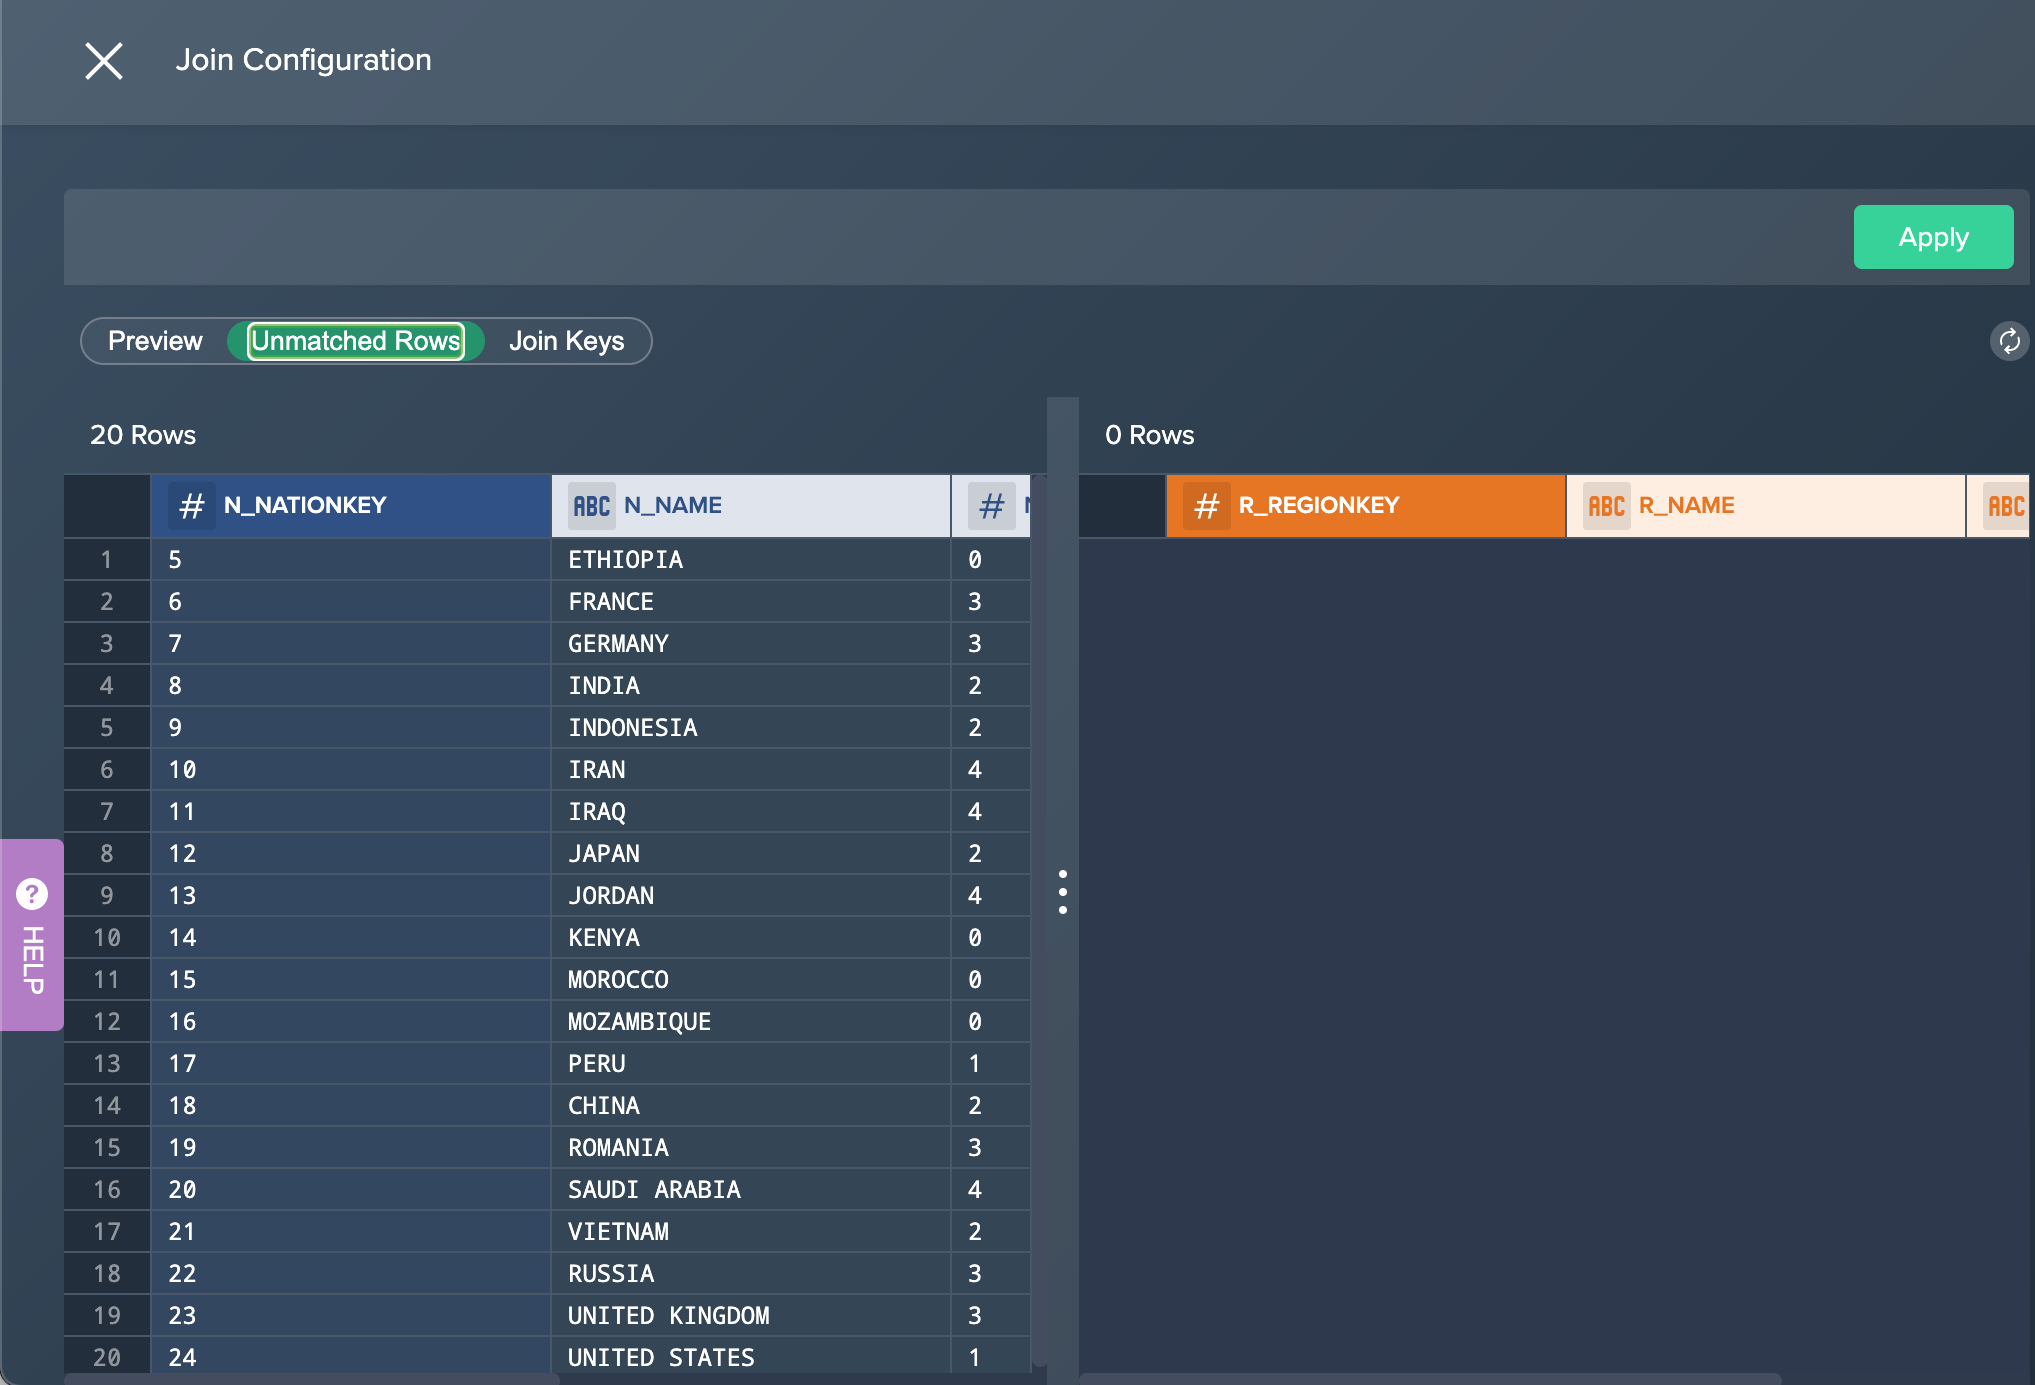
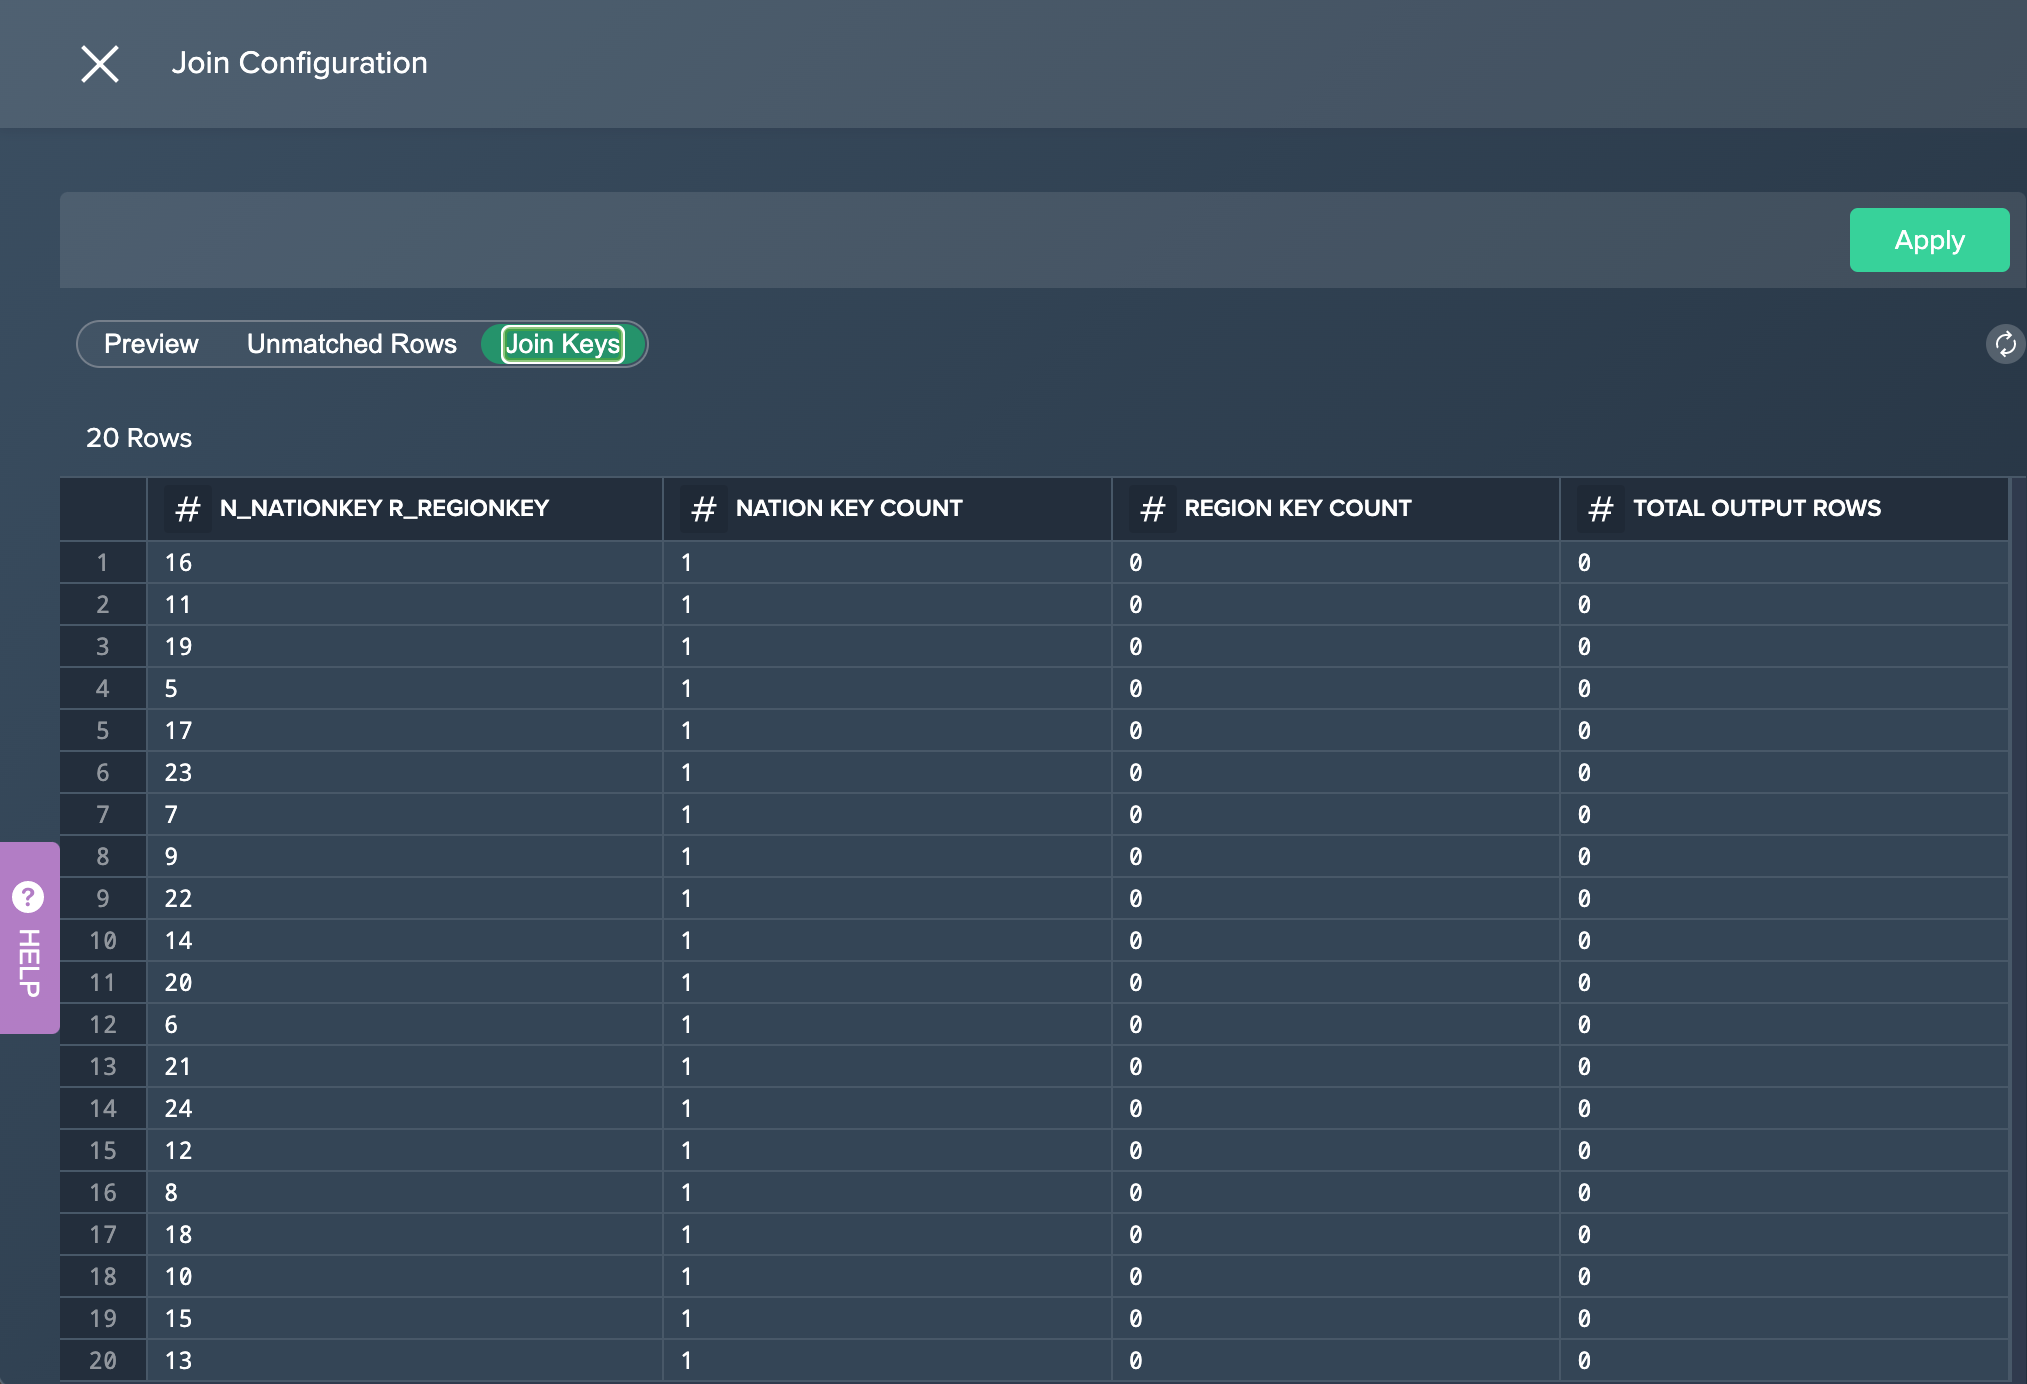
If needed, click on the tabs in the preview to switch between the preview, unmatched rows or join keys.
-
Confirm with "Apply". The configuration applies. The column view is updated. The applied operation is listed in the 'Recipe' list
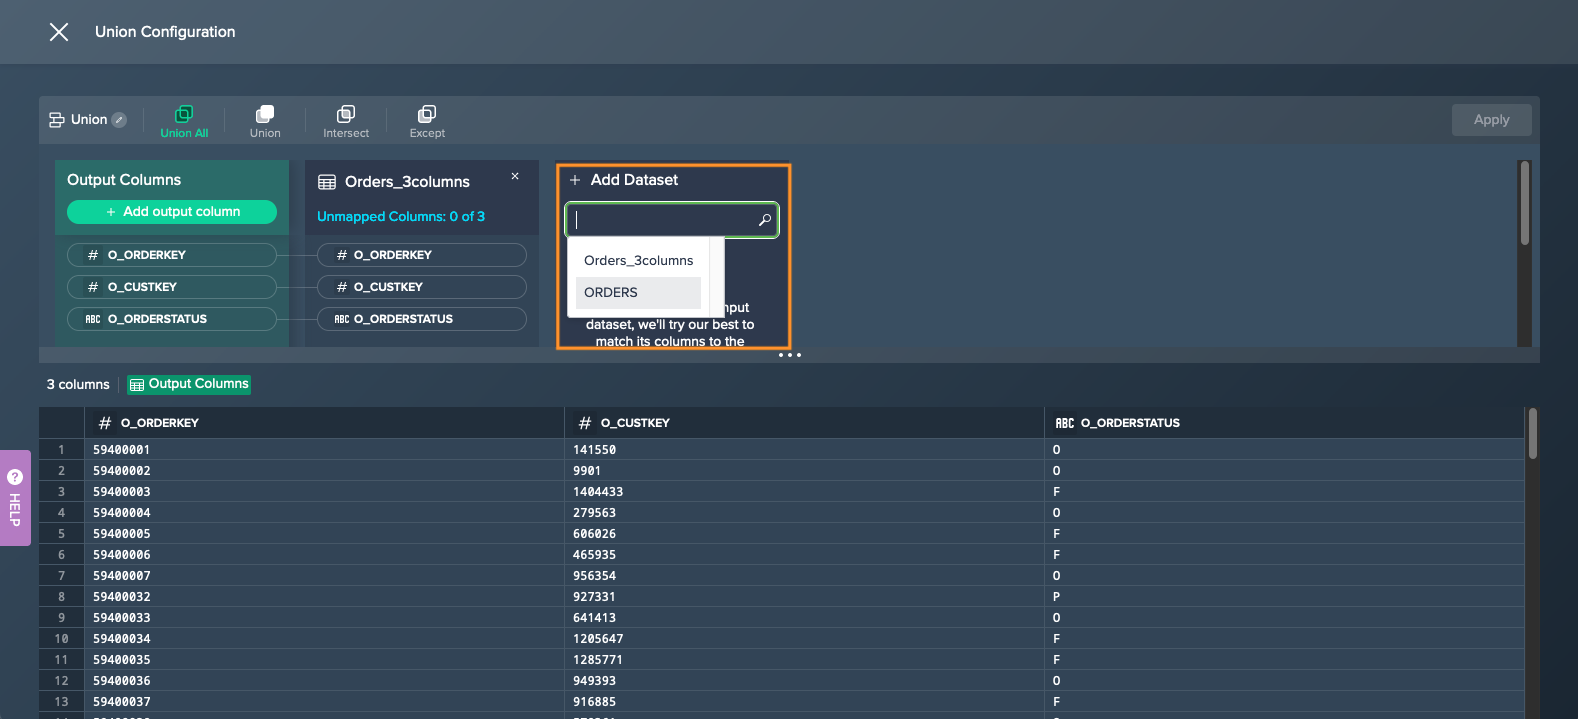
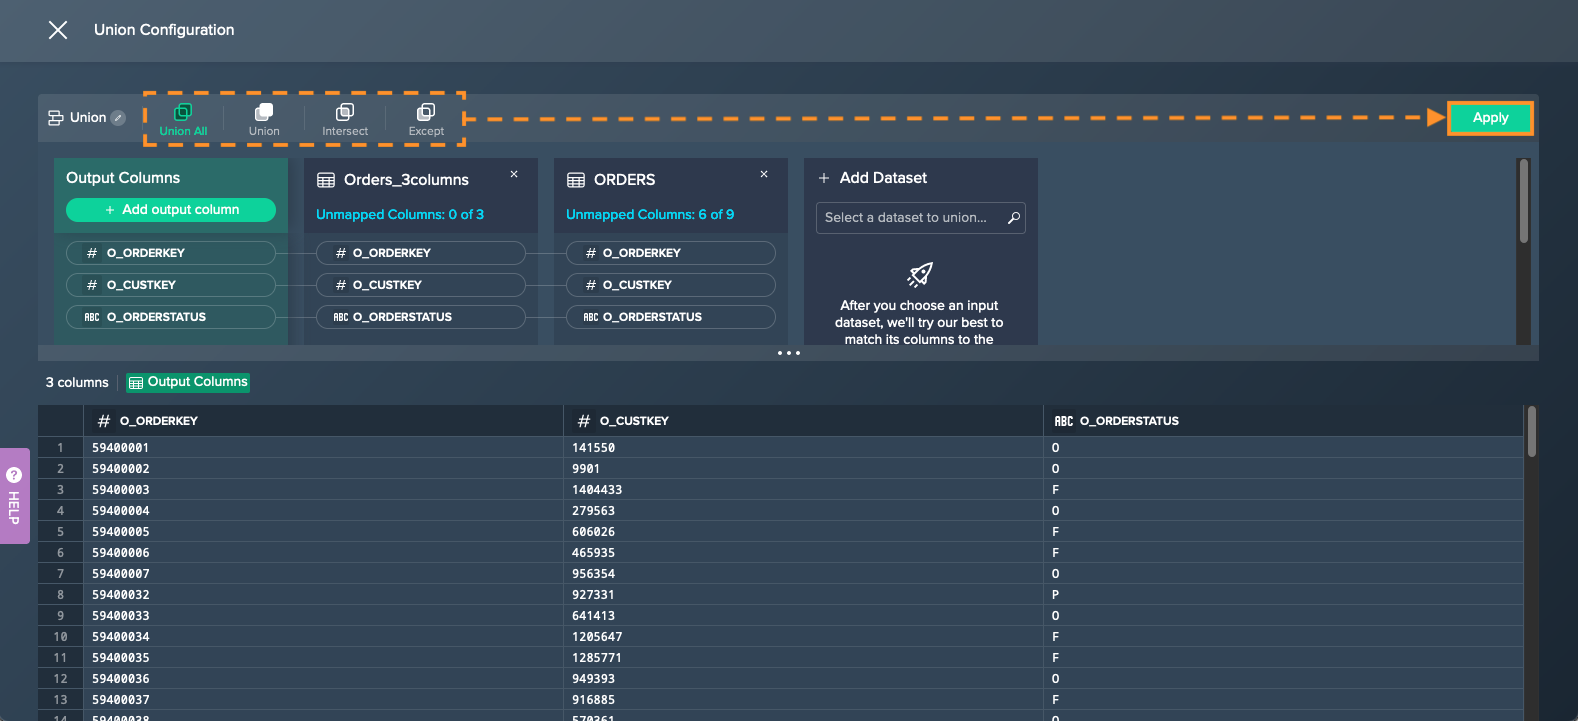
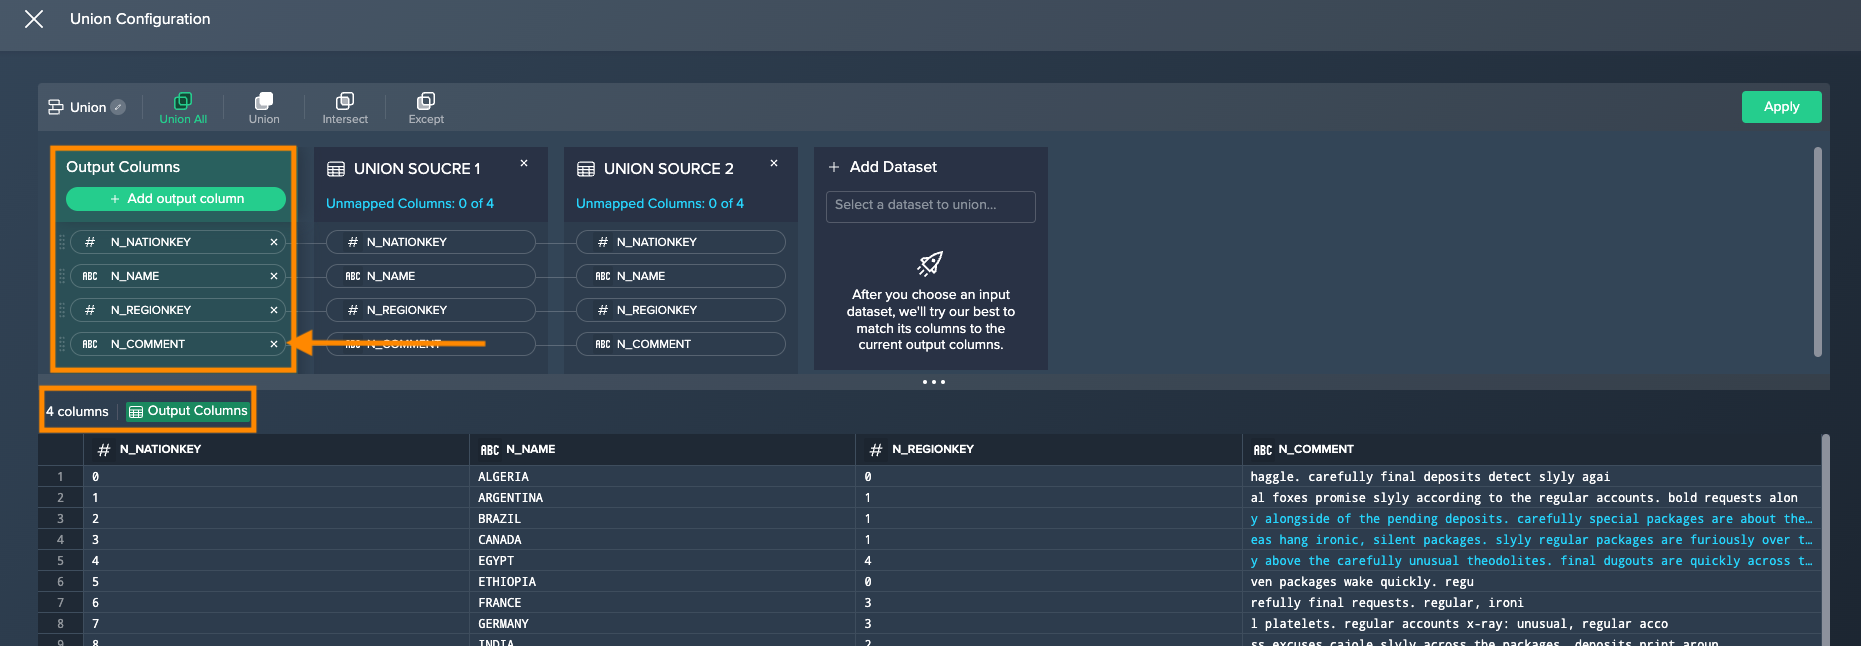
Union#
Use this operation to append the contents of a dataset to the contents of one or more other dataset(s) to create a new combined dataset.
The following applies:
- you can select between four union modes:
- Union All: appends each input dataset together keeping all rows
- Union: appends each input dataset together removing duplicate rows
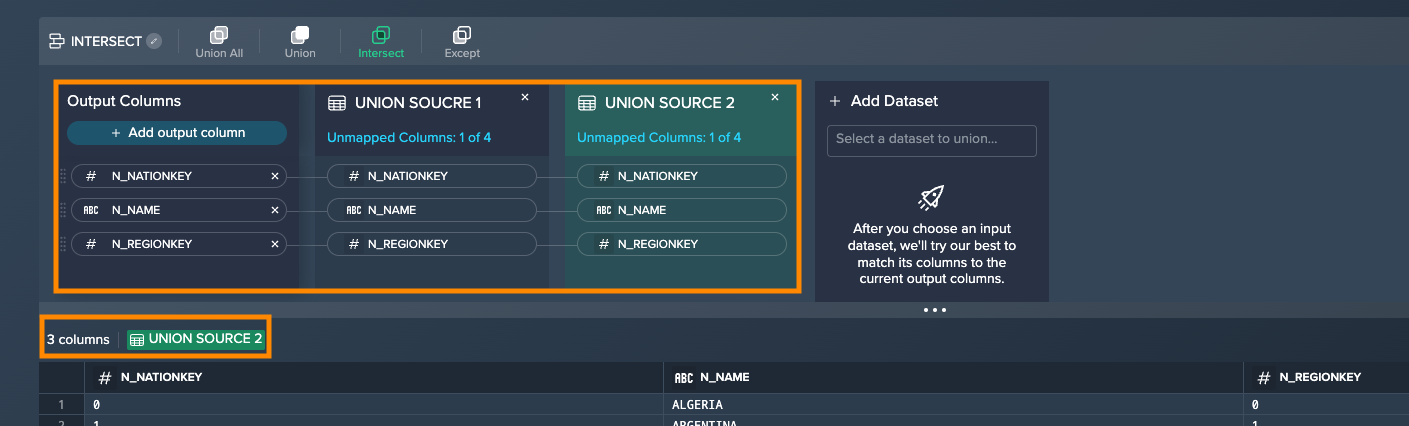
- Intersect: combines each dataset together keeping only the rows that exist in both datasets
- Except: removes rows from the first dataset that match rows from all subsequent datasets
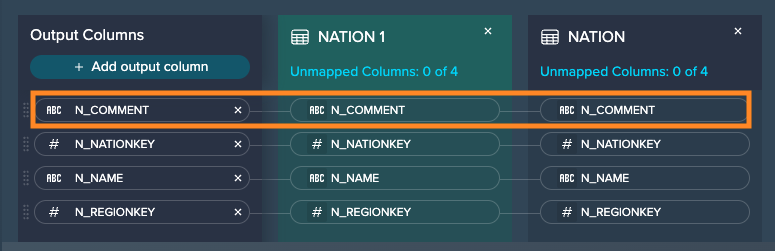
- the number of unmapped columns of the source dataset is shown
- you can rename the union within the configuration page
- the output columns are displayed as a preview below
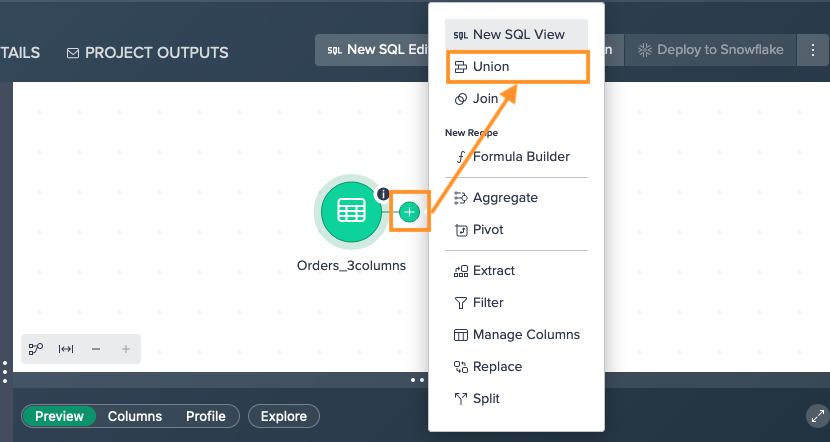
To union:
-
Click on the "+" next to the dataset and select "Union". The operations configuration opens.
-
Click on "Select a dataset to union.." and select at least a second dataset. The union mode applies and the preview is shown below.
-
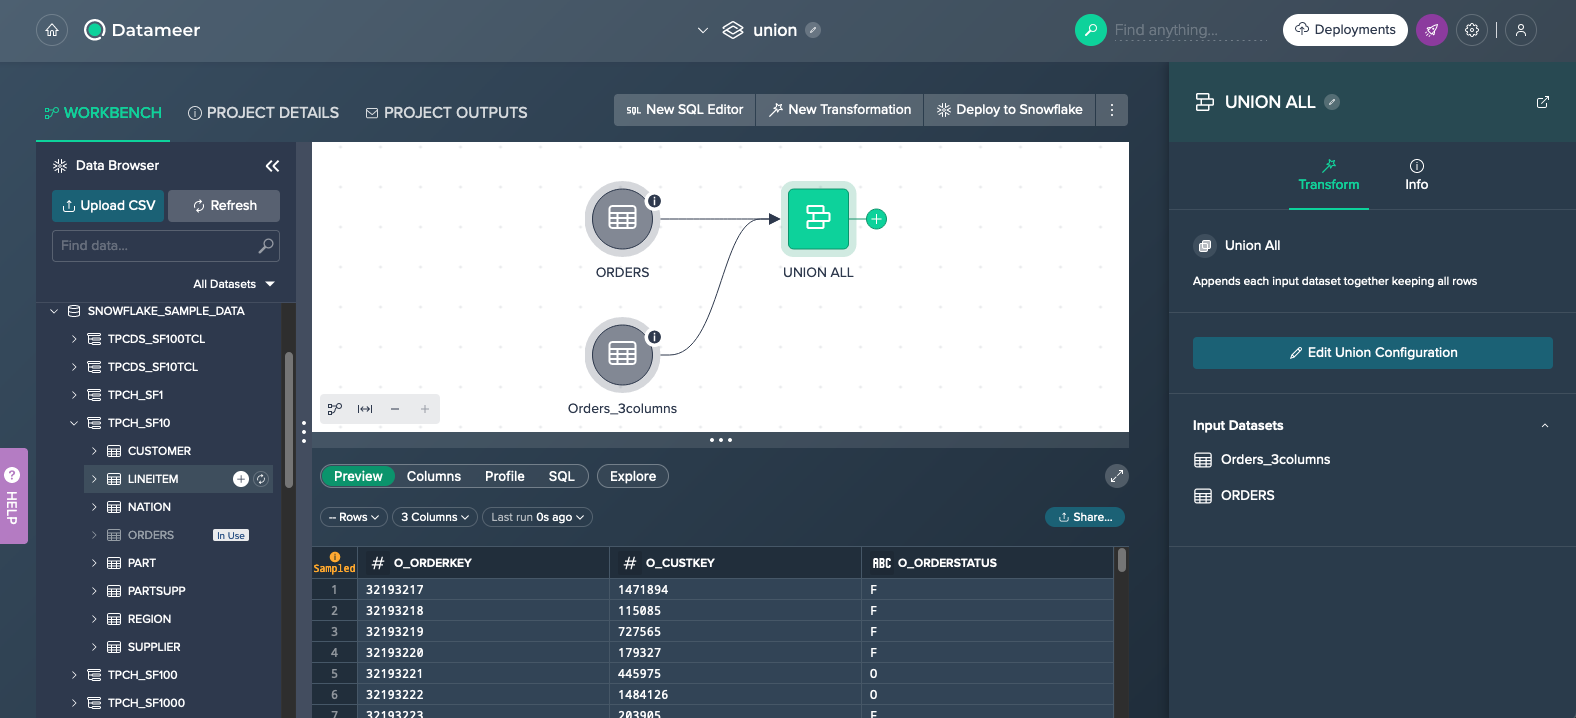
If needed, change the union mode or adjust the unmapped columns and confirm with "Apply". The union is configured. The union node appears in the Flow Area, connected to the source data.
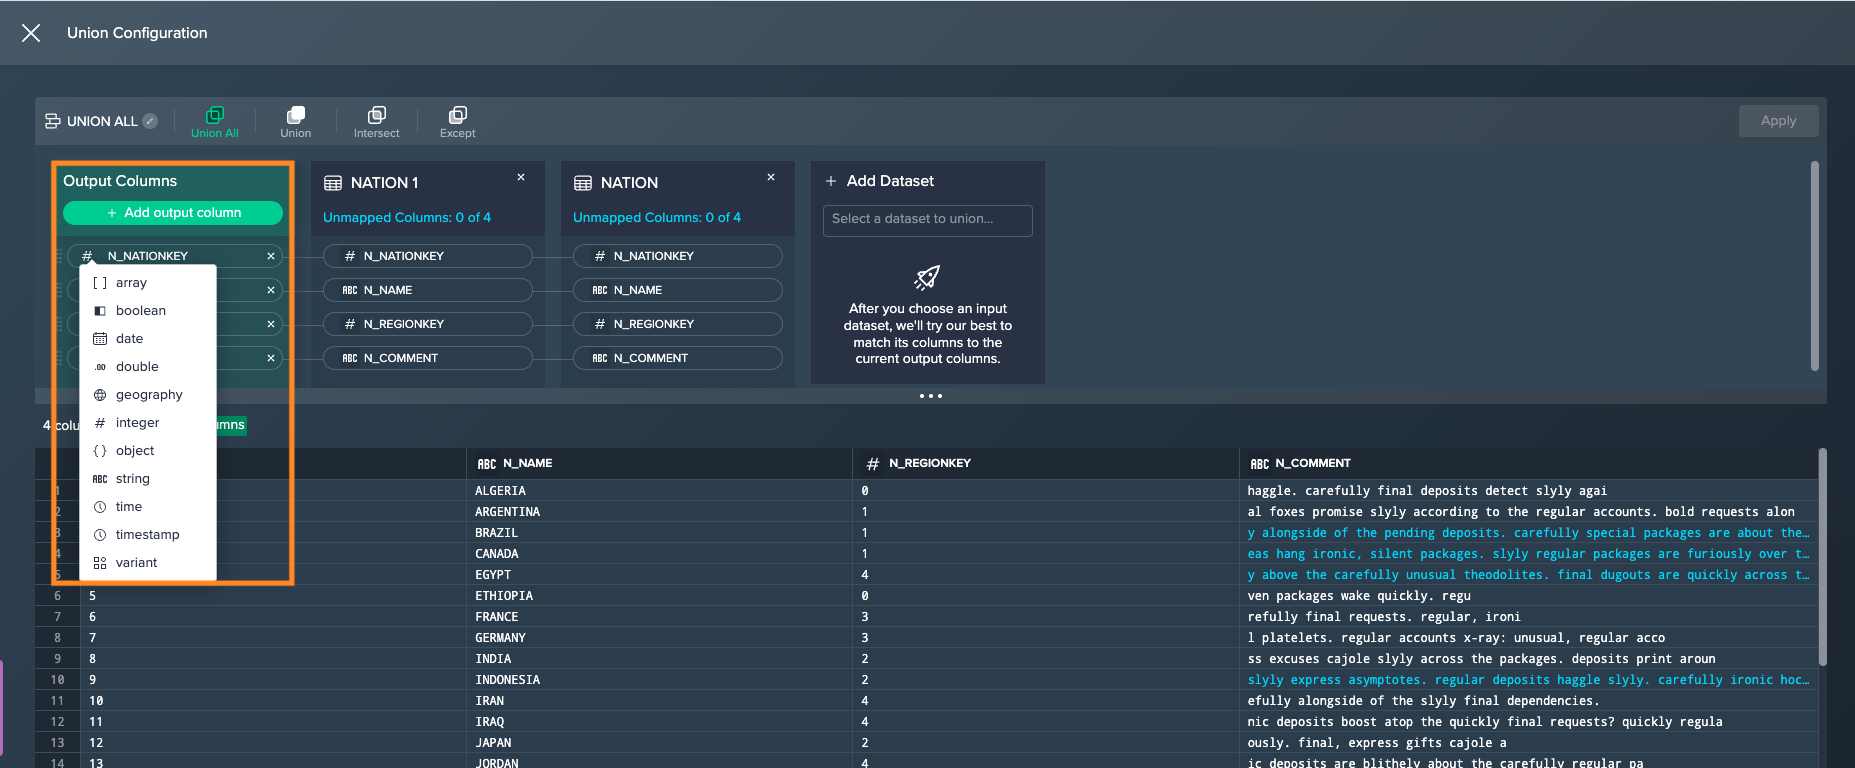
Configure Output Columns#
The output columns can be configured as follows:
Select a different type for the output column by clicking on the type icon. The new column type is applied and an updated preview is shown below.
INFO: Changing the column type may result in coercion errors in the preview.
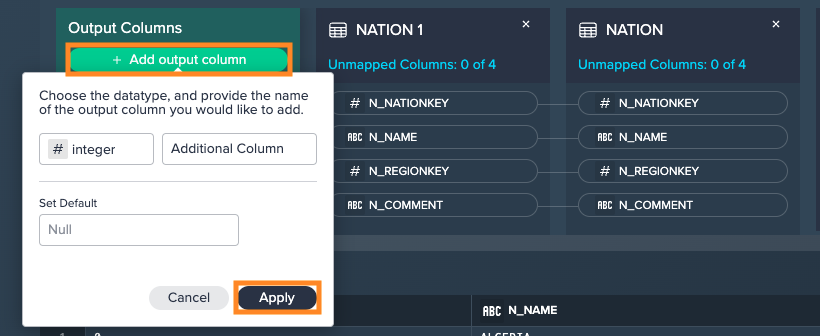
Add output columns by clicking on "Add output column". Provide a column type and name, and if needed set a default value. Confirm with "Apply". The additional column is listed and the updated preview is shown below.
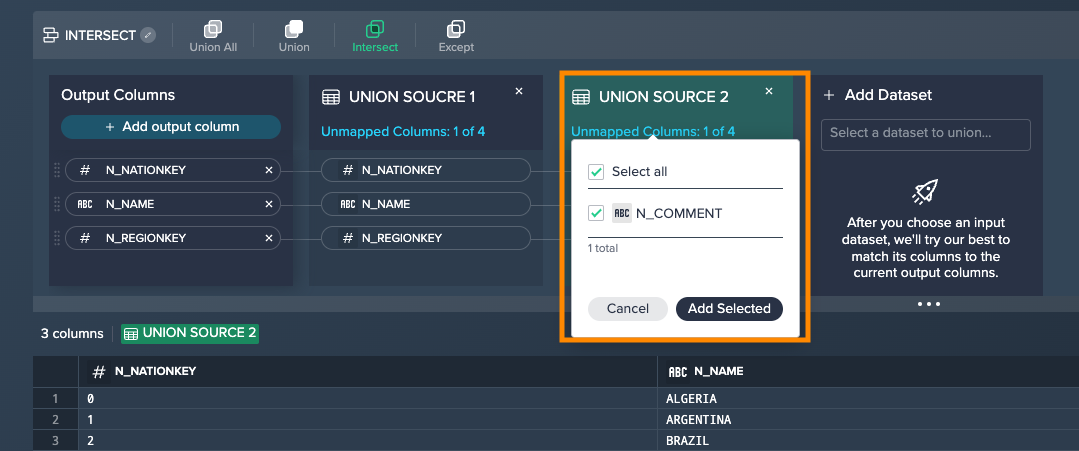
Remove columns from the output schema by clicking on the "x" at the column and confirming with "Yes". The column is removed from the output schema and the updated preview is shown below.
INFO: The removed column(s) can be restored via the "Unmapped Columns" dialog.
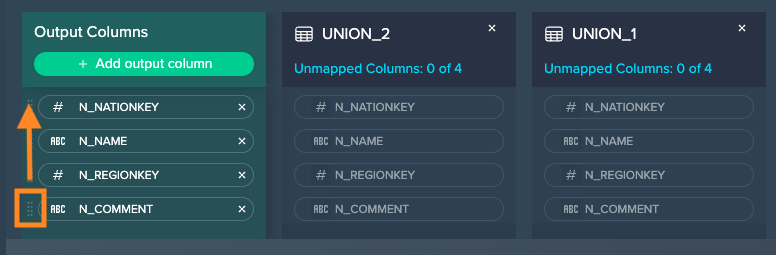
Reorder the output columns by clicking the handle at the column and moving it up or down within the columns list. The columns are reordered in the output schema and the updated preview is shown below.
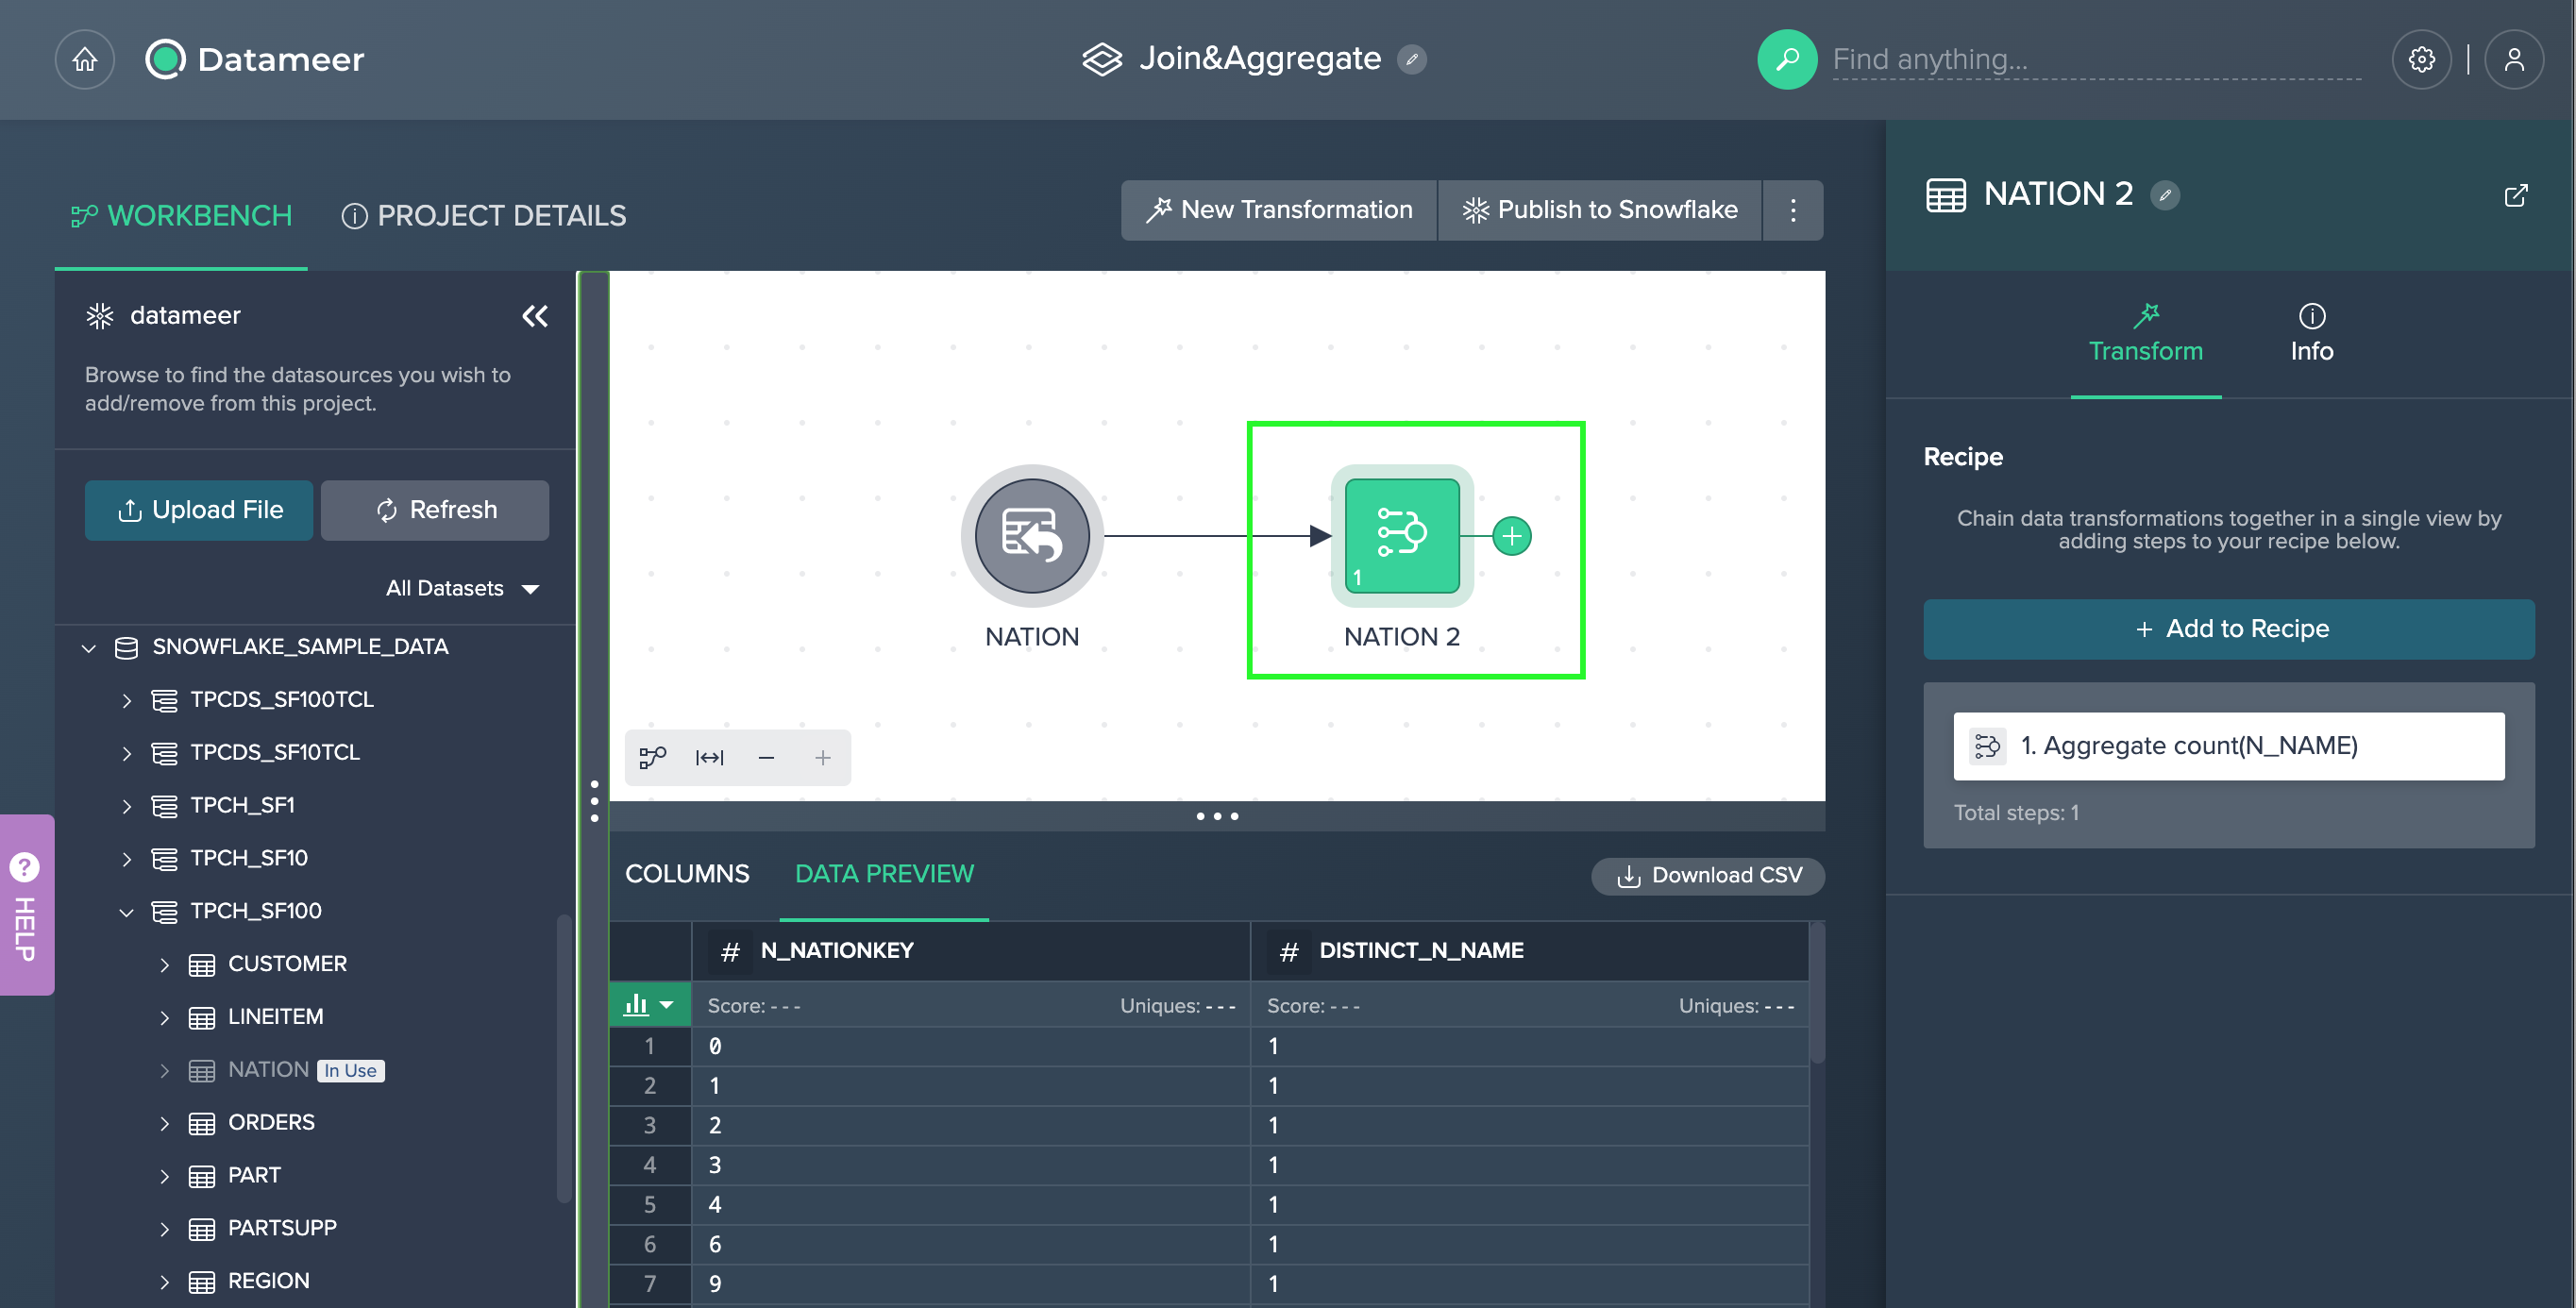
Aggregate#
Use this operation to summarize your data by aggregating over one or more dimensions. Furthermore you can also add measures to your aggregations or display the total count.
The following applies:
- the order of group bys and measures can be rearranged
- the 'Count' operation is optional
- the 'Measures' operation is optional
- the following aggregate functions can be applied:
| Column Type | Aggregation Type |
|---|---|
| Numeric | Any, ApproxCount, Avg, Count, CountDistinct, Kurtosis, Max, Median, Min, Mode, Skew, StdDev, StdDevPop, Sum, VarPop, Var |
| Non-Numeric | Any, ApproxCount, Count, CountDistinct, Max, Min, Mode |
Further information about data types can be found in the Snowflake Documentation
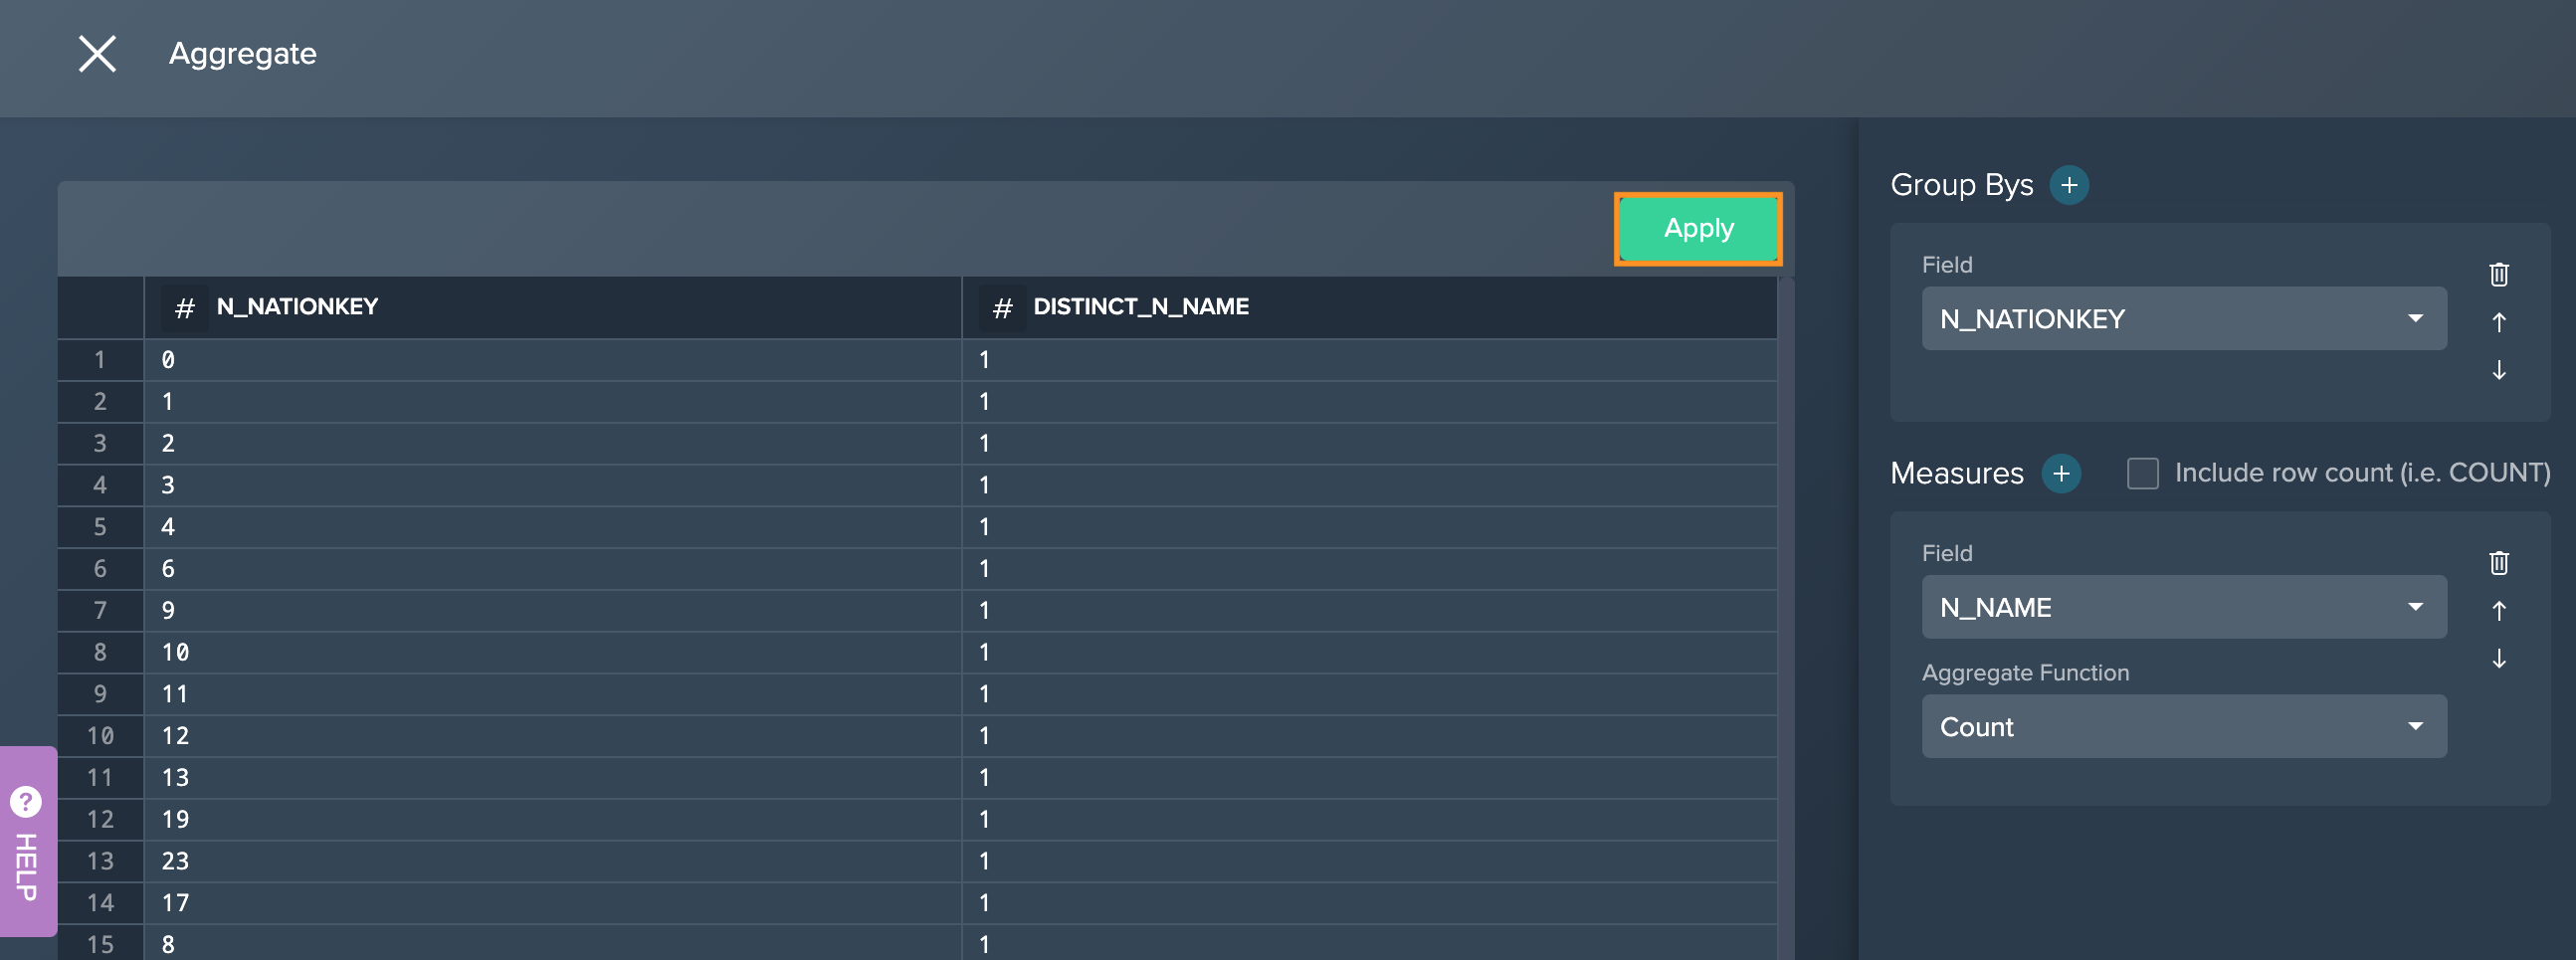
To aggregate:
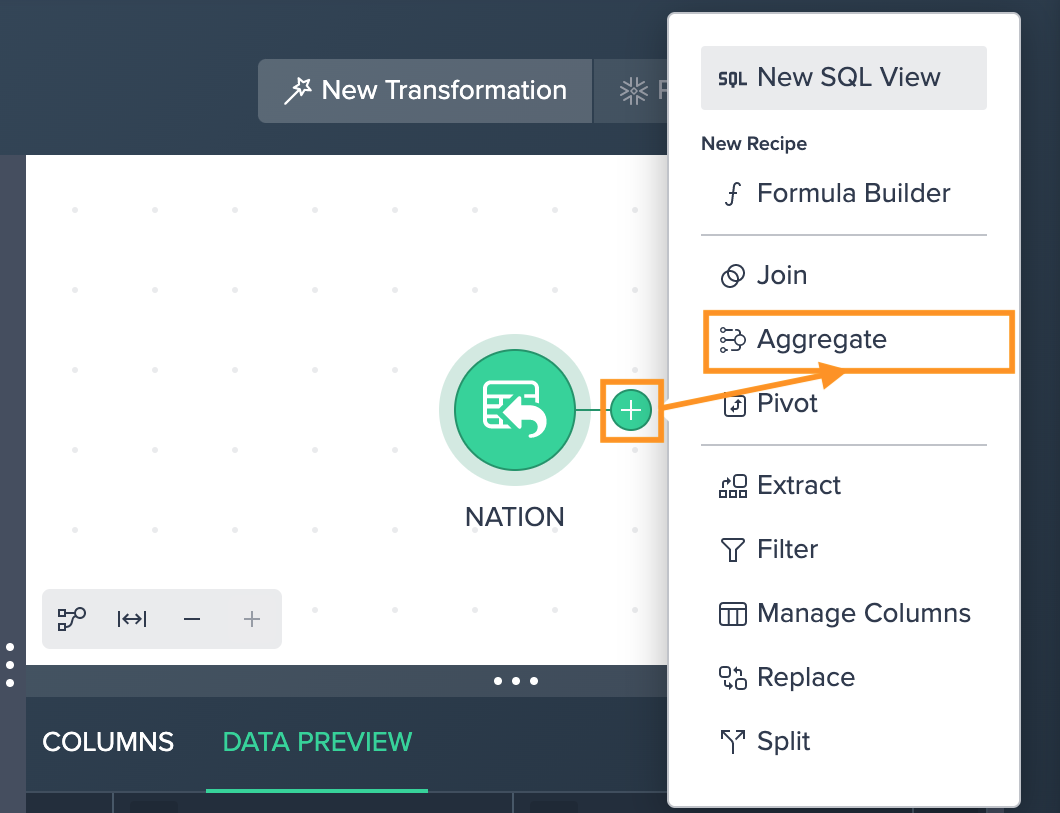
-
Click on the "+" next to a dataset and select "Aggregate". The operations configuration opens.
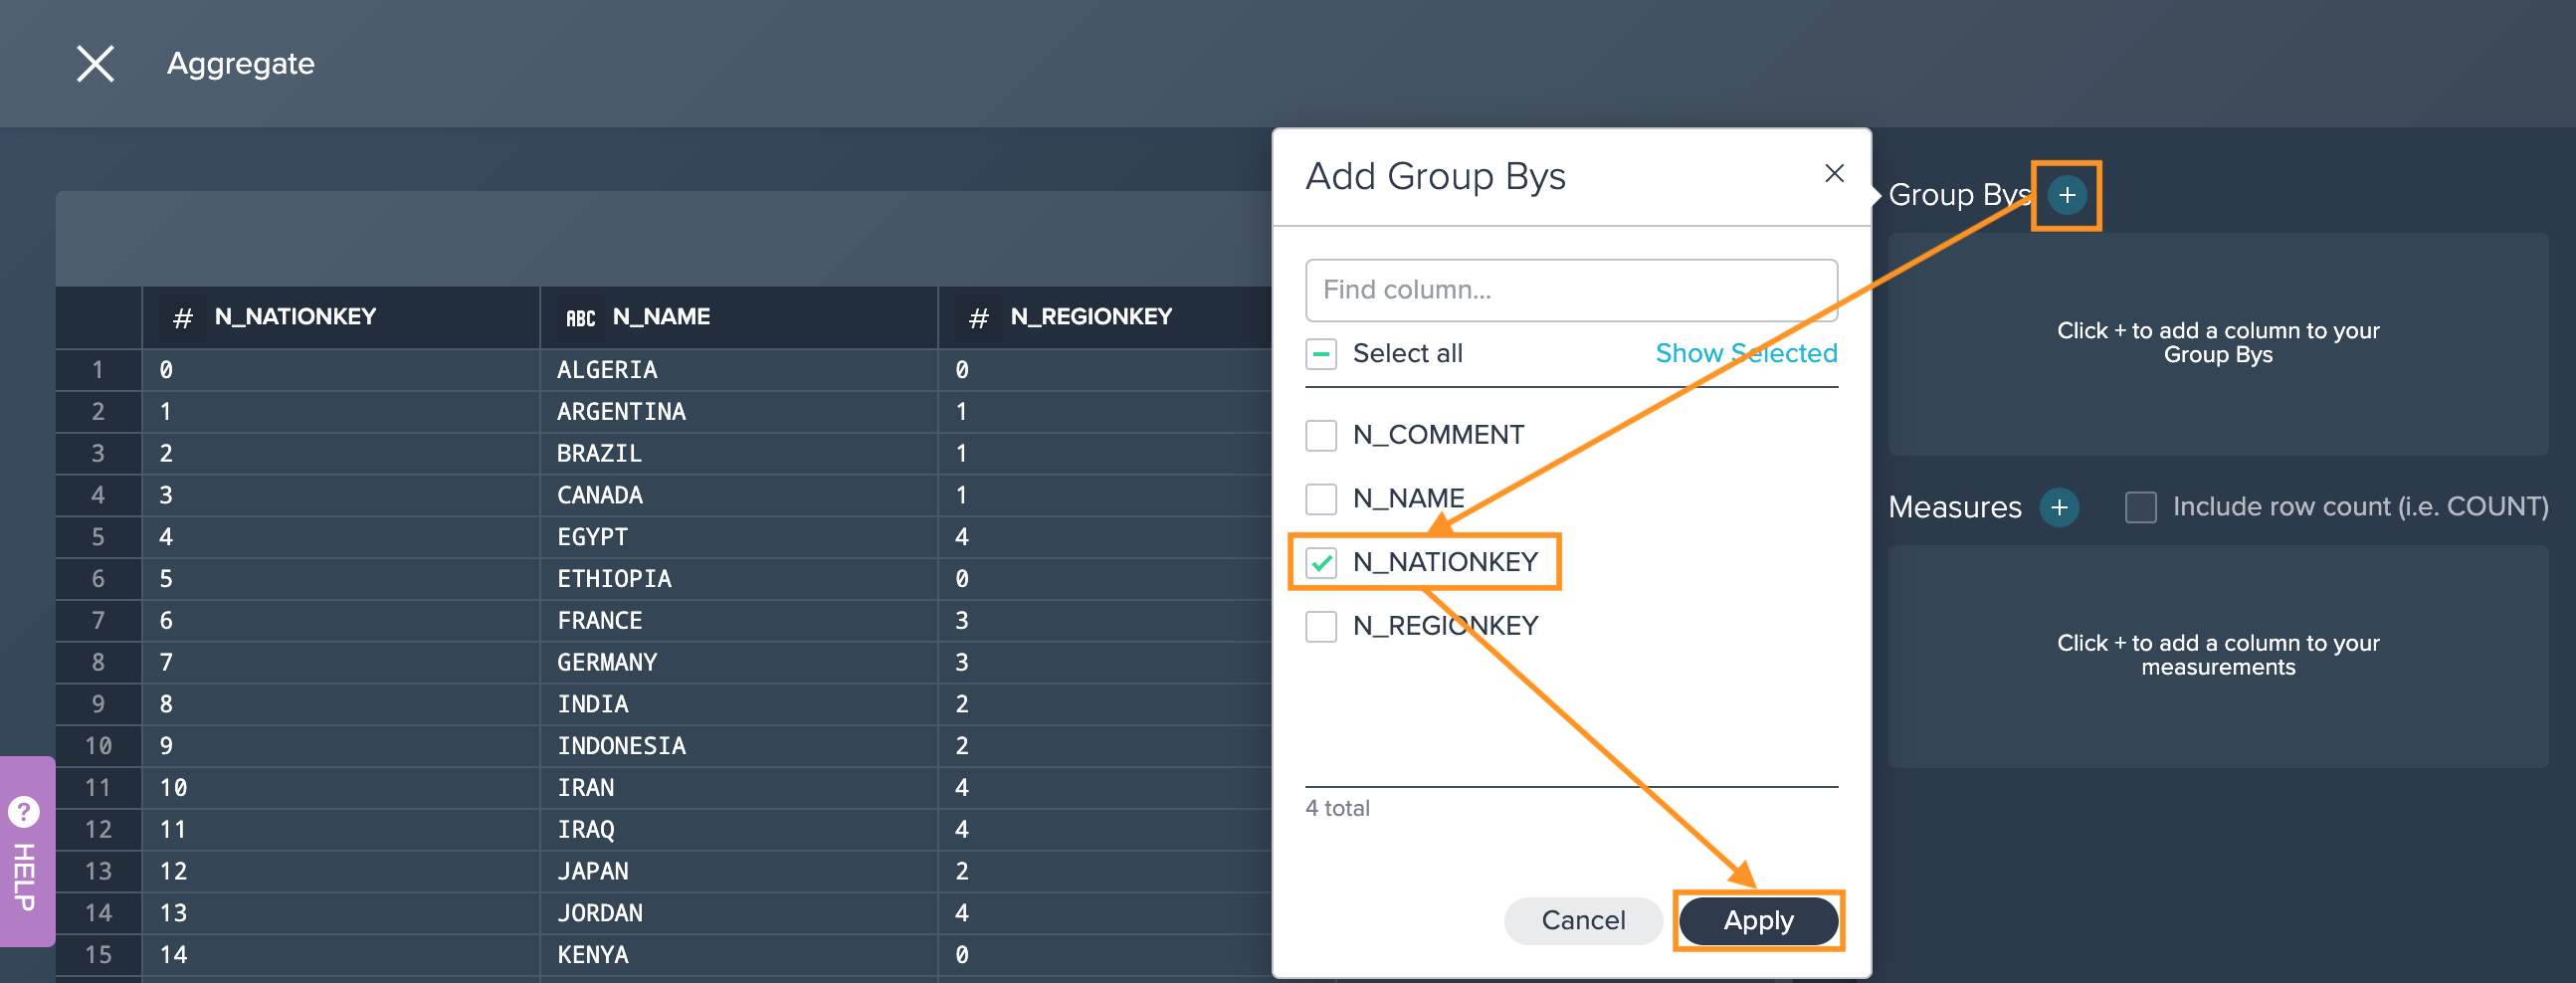
-
Click on the "+" next to 'Group Bys' field, select at least one of the columns you want to group by and confirm with "Apply".
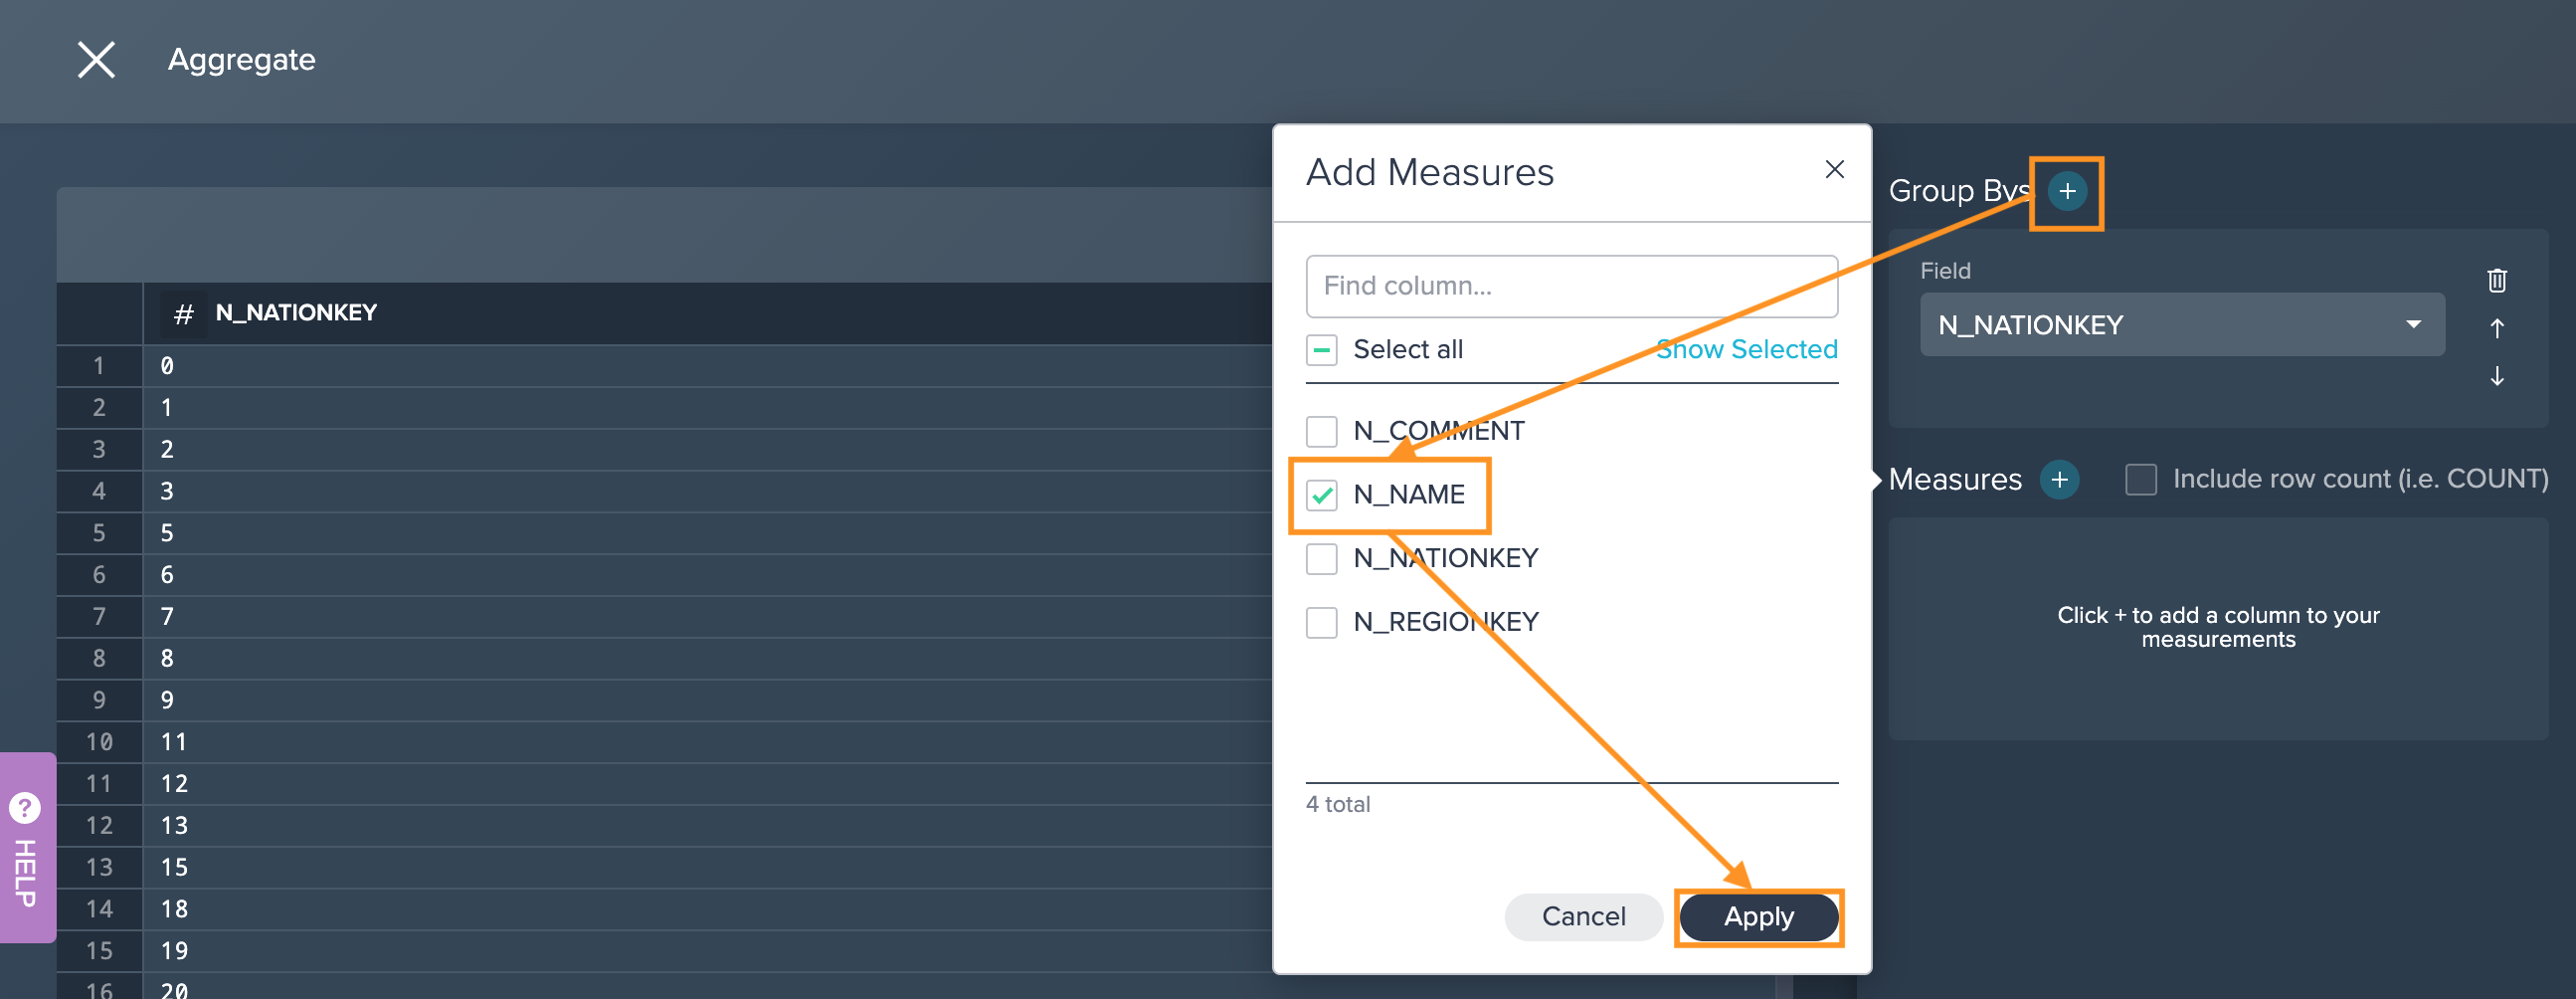
-
Click on the "+" next to the 'Measures' field, select at least one of the columns you want to measure and confirm with "Apply". (Optional) Click on the 'Count' icon to count globally based on the combined resulting row groups.
-
Confirm with "Apply". The operation is proceeded. The new node appears in the Flow Area. The operation stack contains the proceeded light data preparation operation.
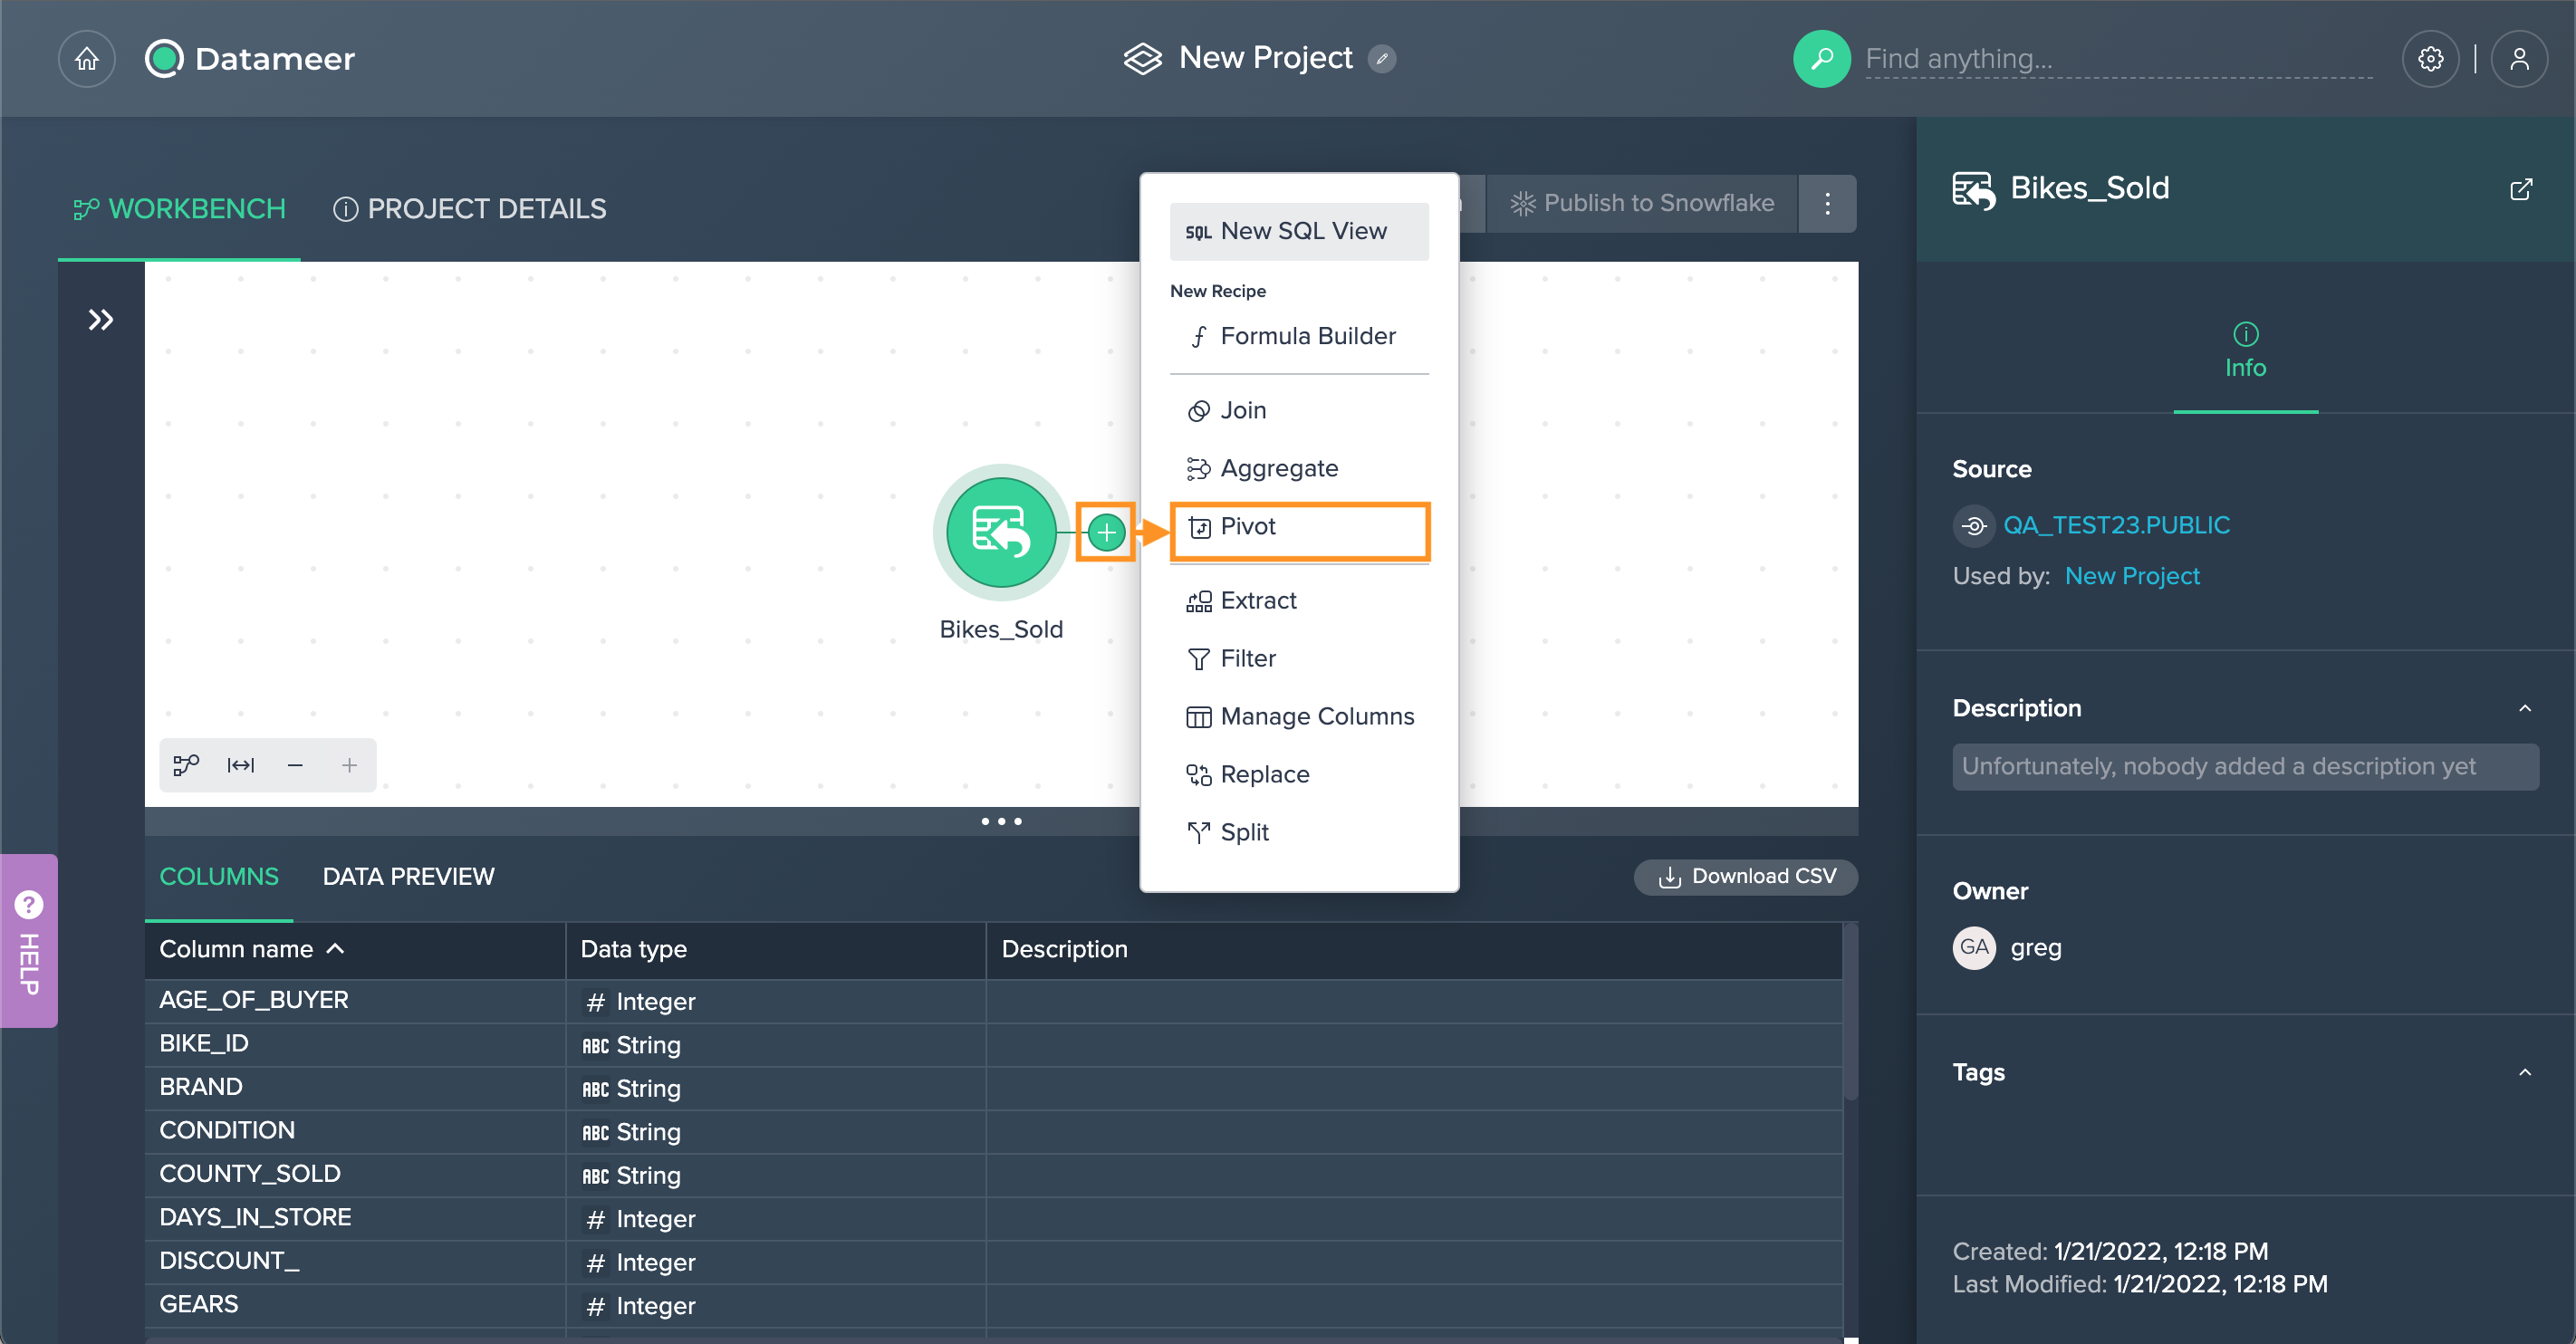
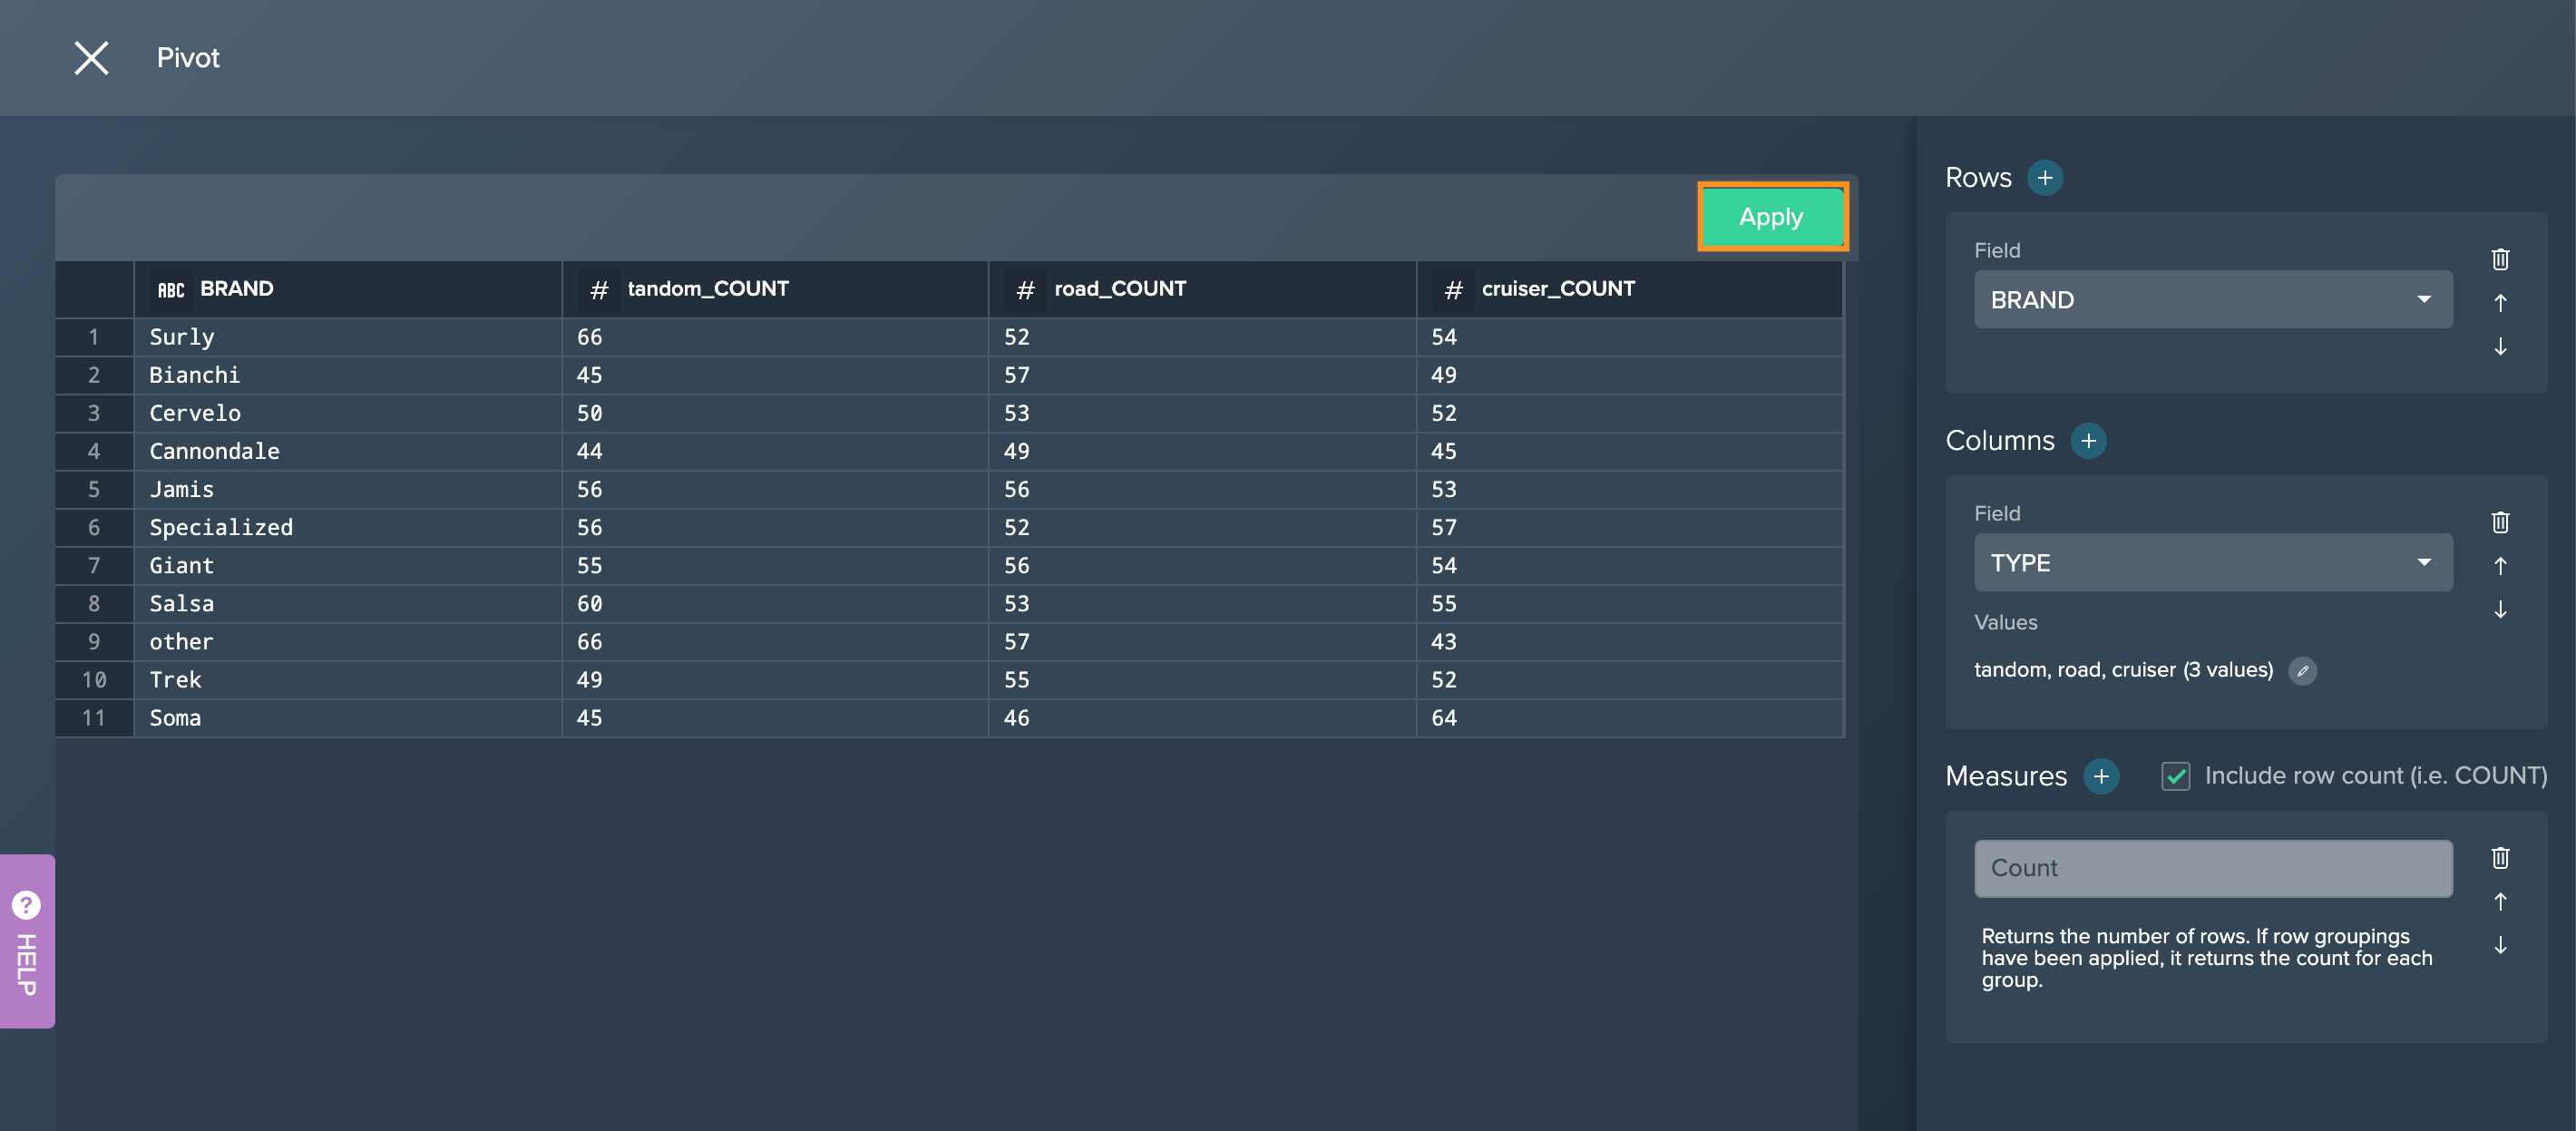
Pivot#
Use this operation to summarize your data by pivoting on one or more dimensions.
The following applies:
- columns with high cardinality (a column has more than 100 different values) are disabled in the column dimension
To pivot:
-
Click on the "+" next to a dataset and select "Pivot". The operations configuration opens.
-
Click on the "+" next to 'Rows', select the columns to your row dimension and confirm with "Apply".
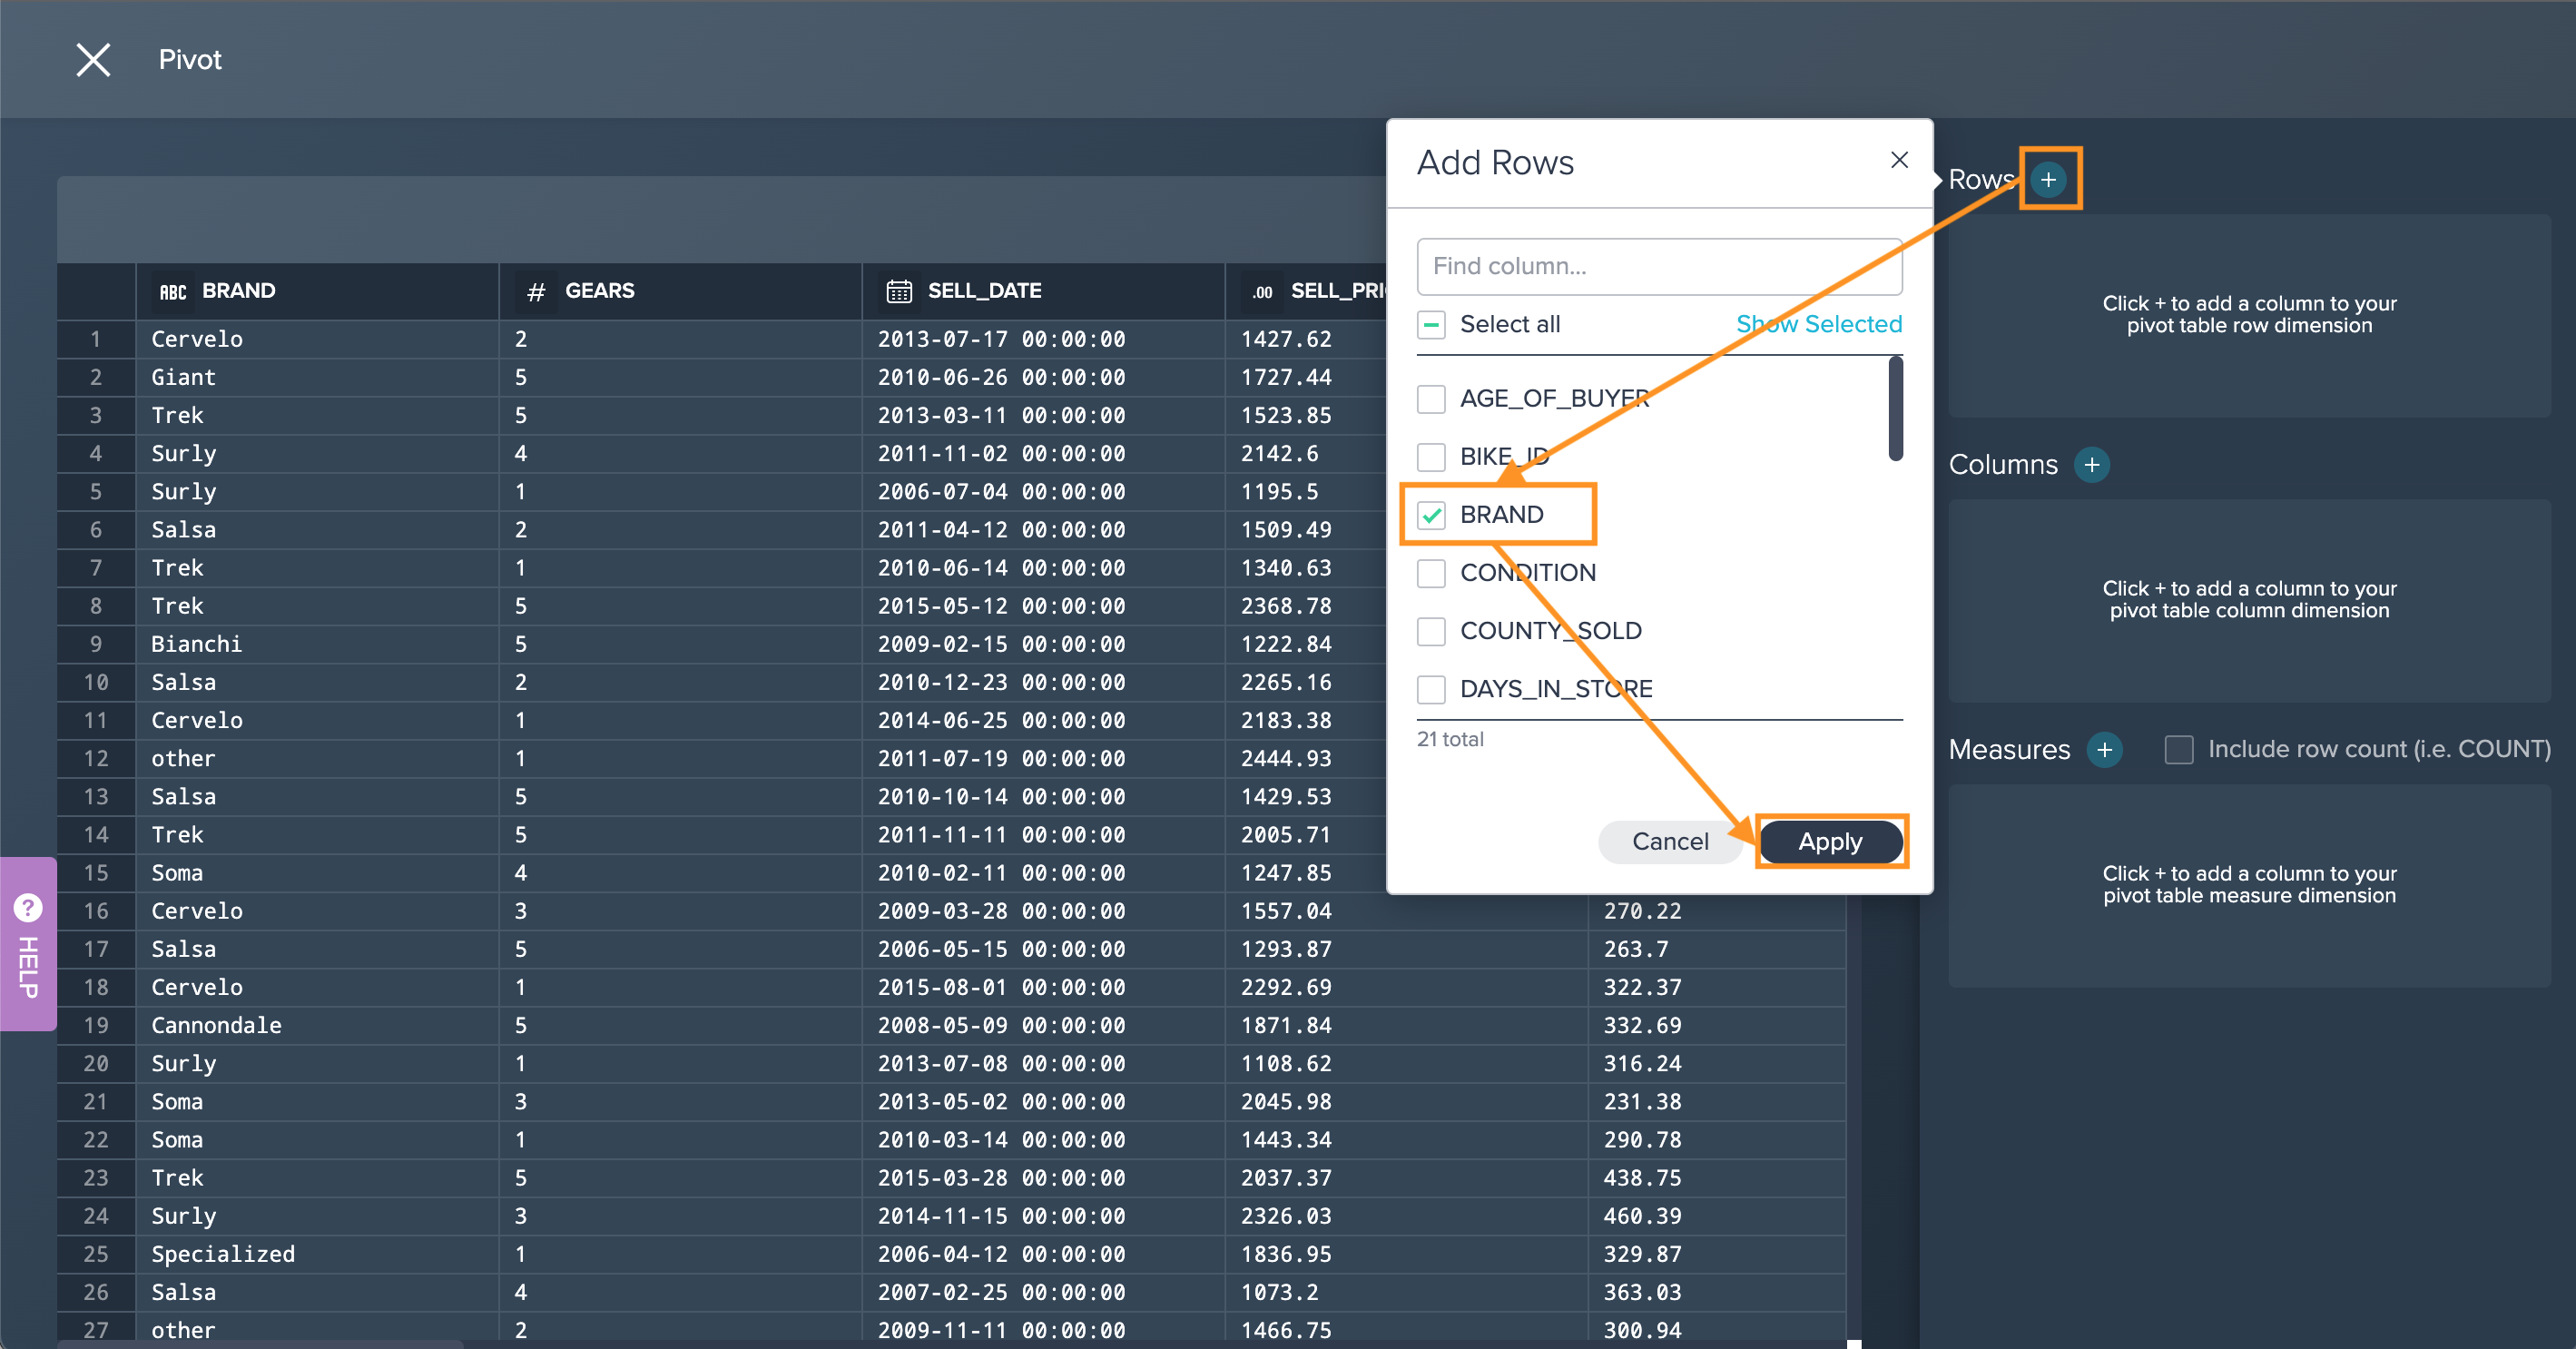
-
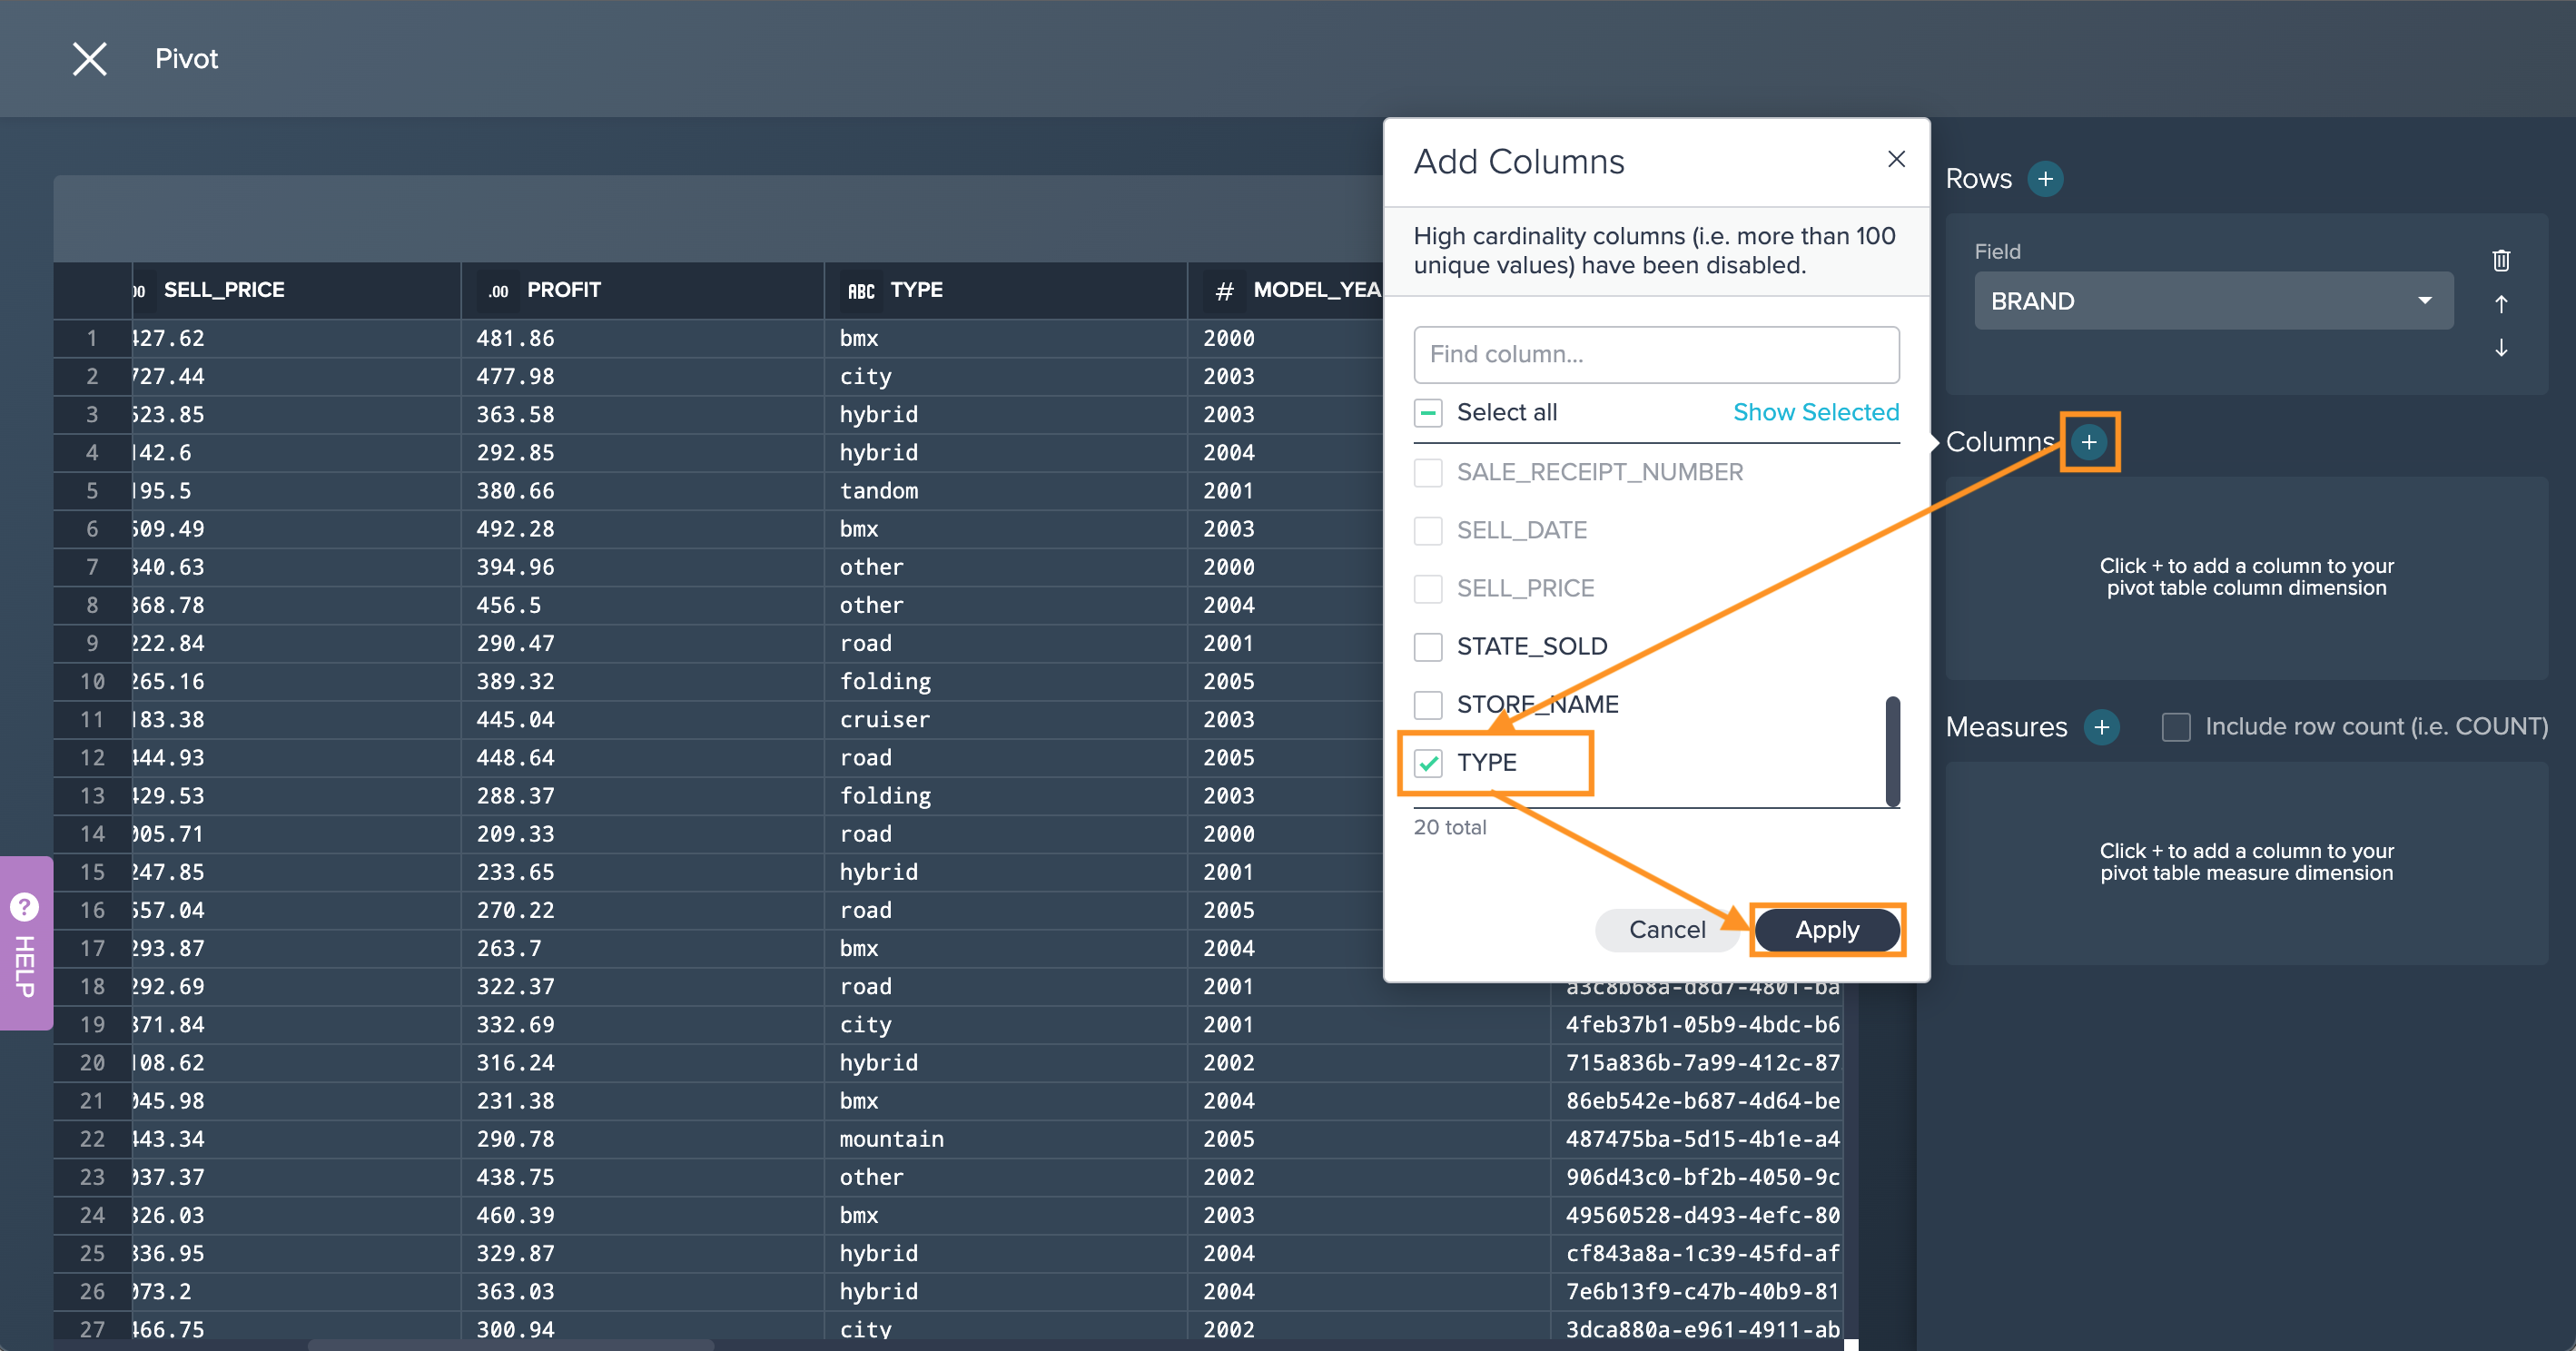
Click on the "+" next to 'Columns', select the columns to your column dimension and confirm with "Apply". Note that only columns with a cardinality under 100 are selectable.
-
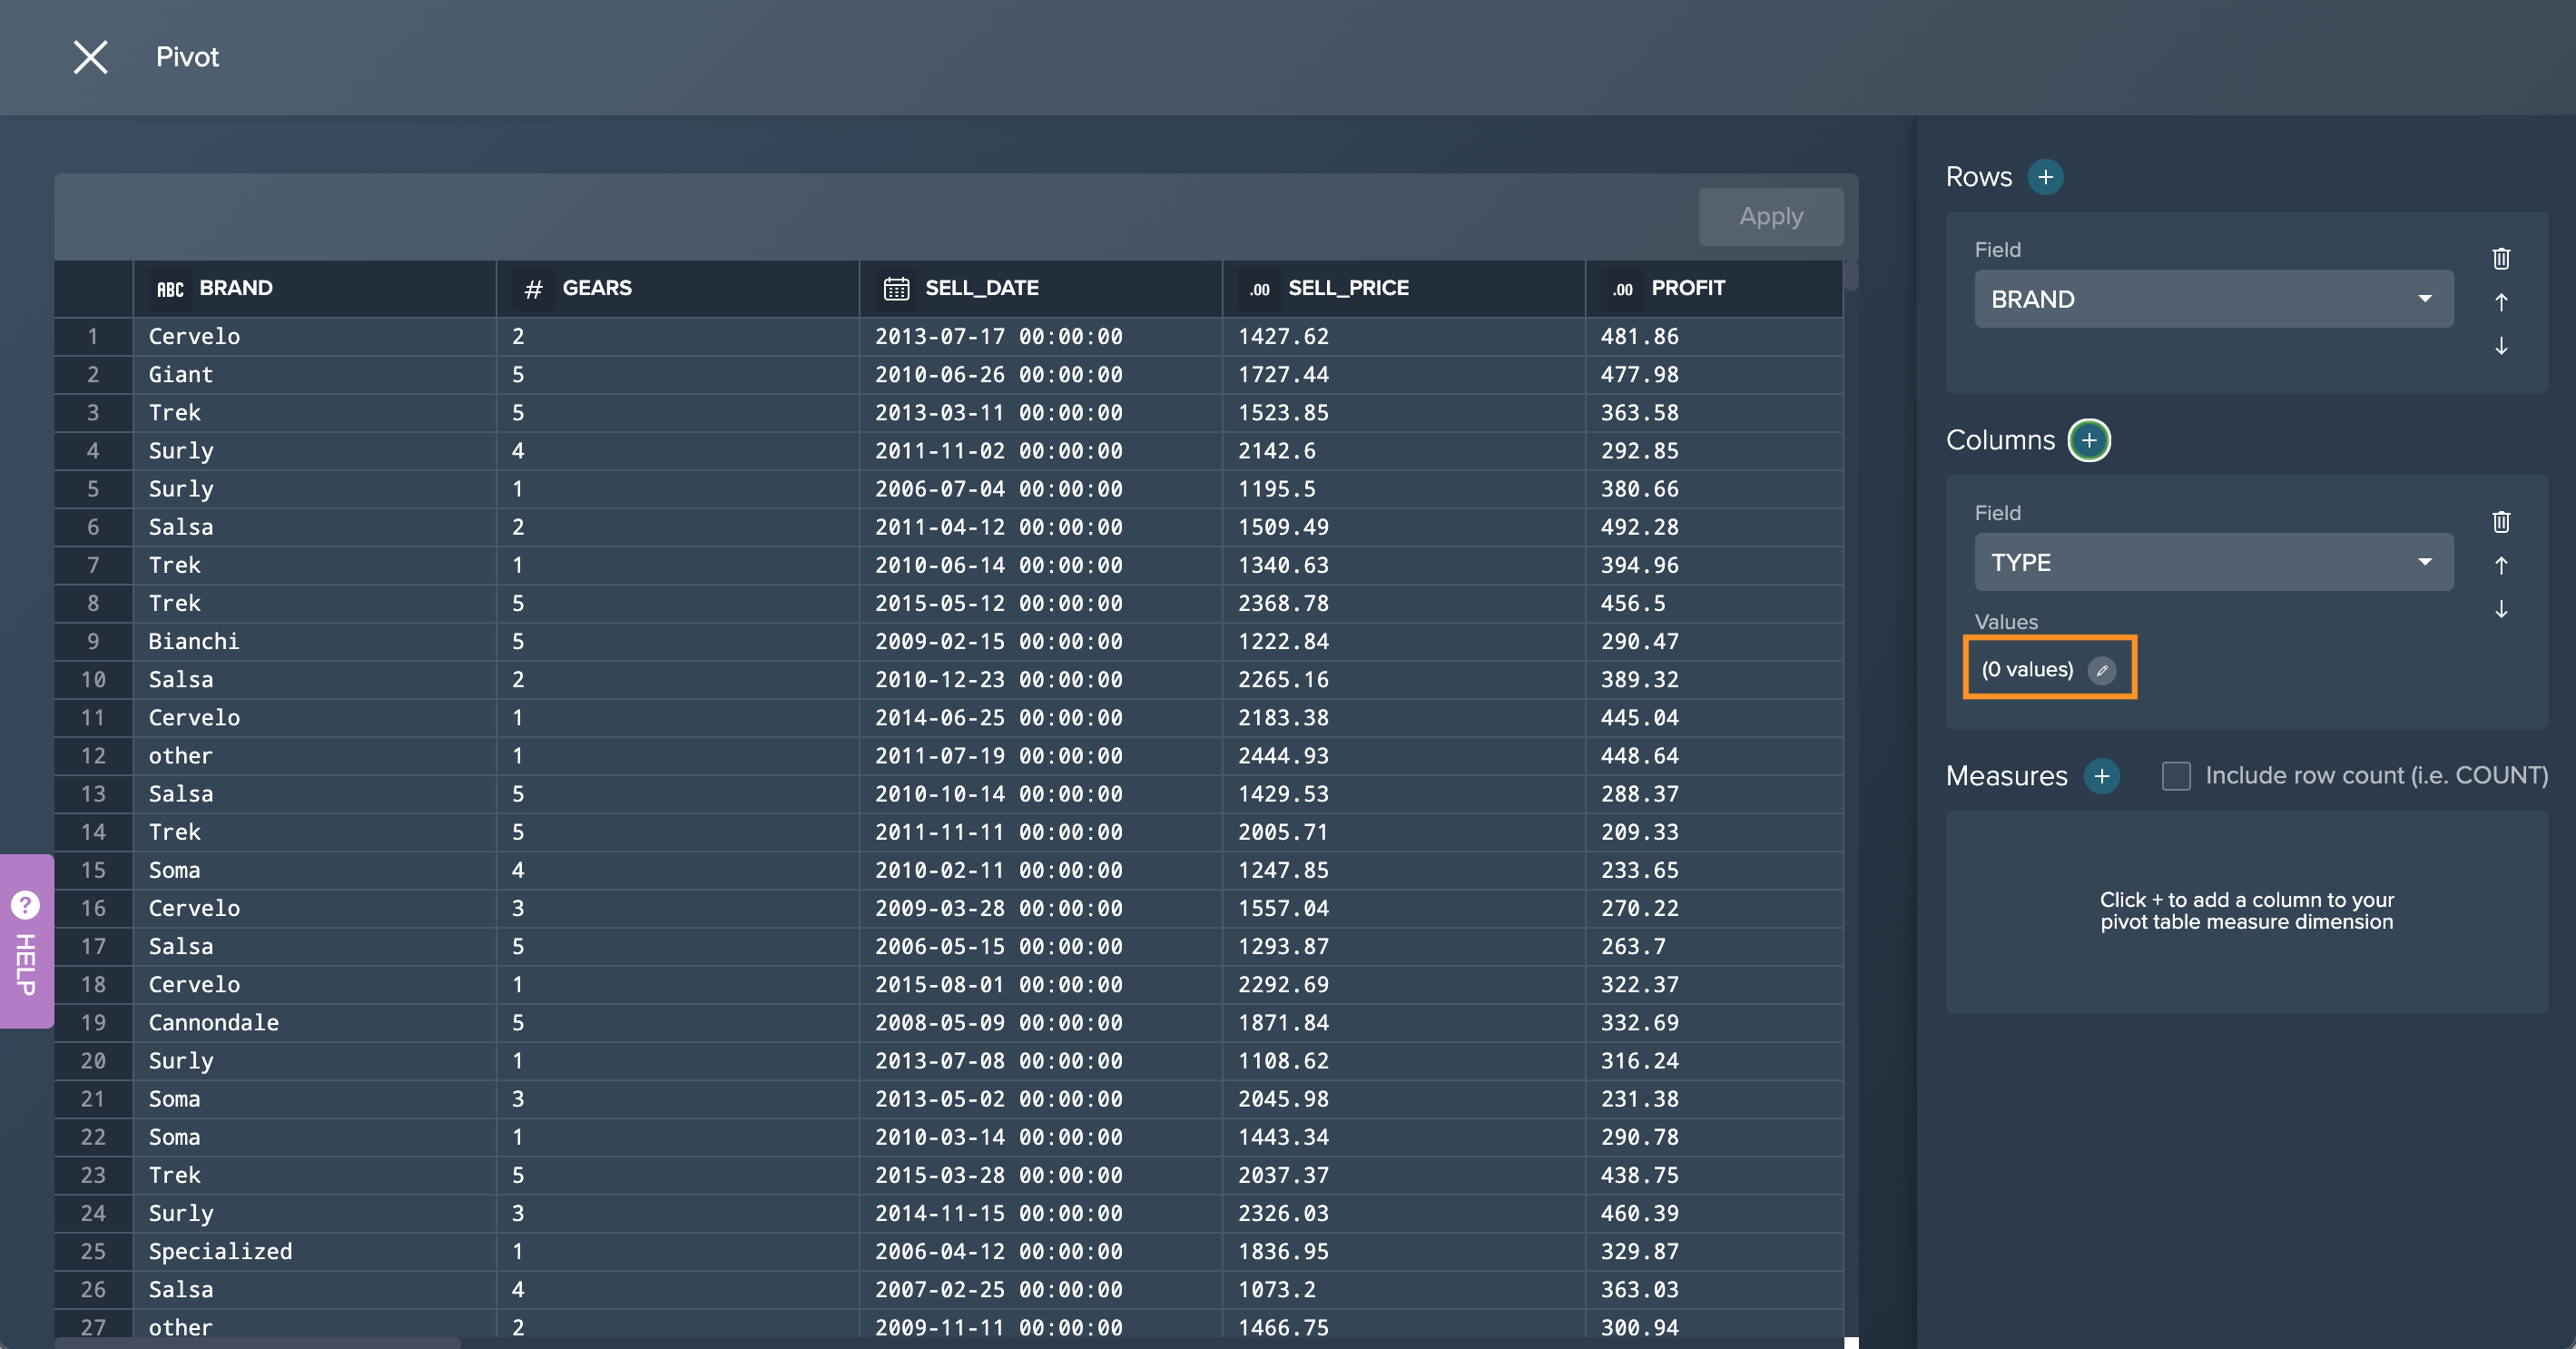
Click on the edit icon to set the values.
-
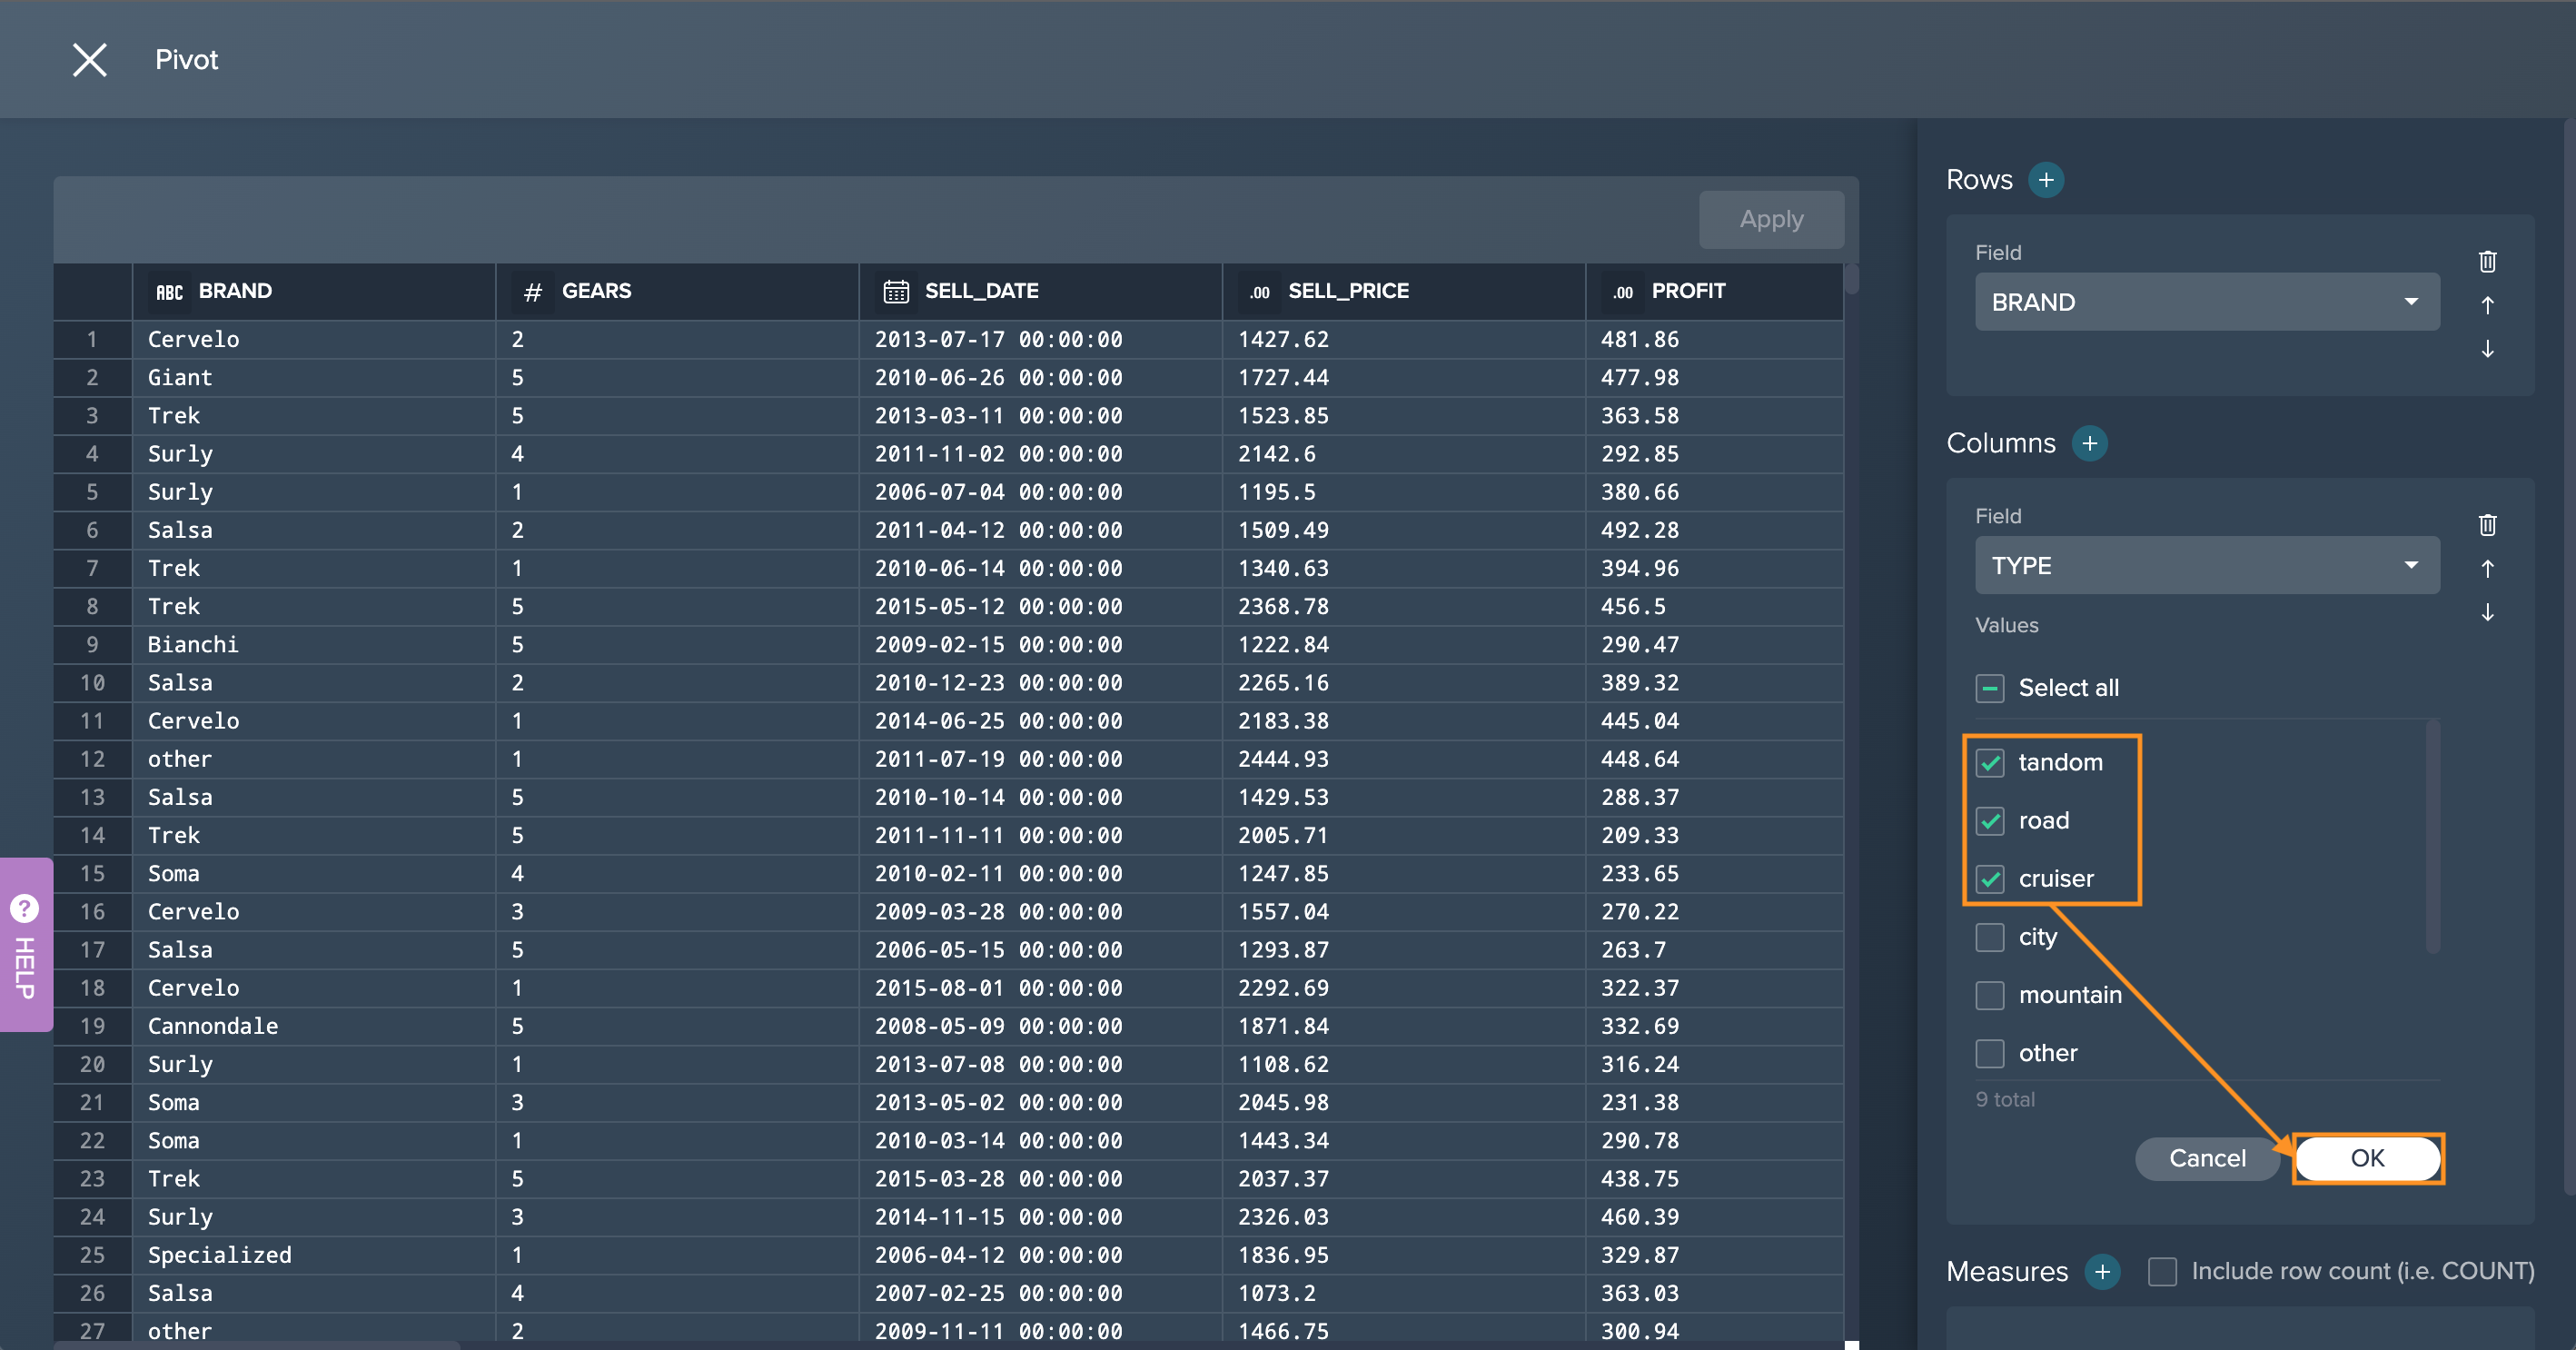
Mark the required values and confirm with "OK".
-
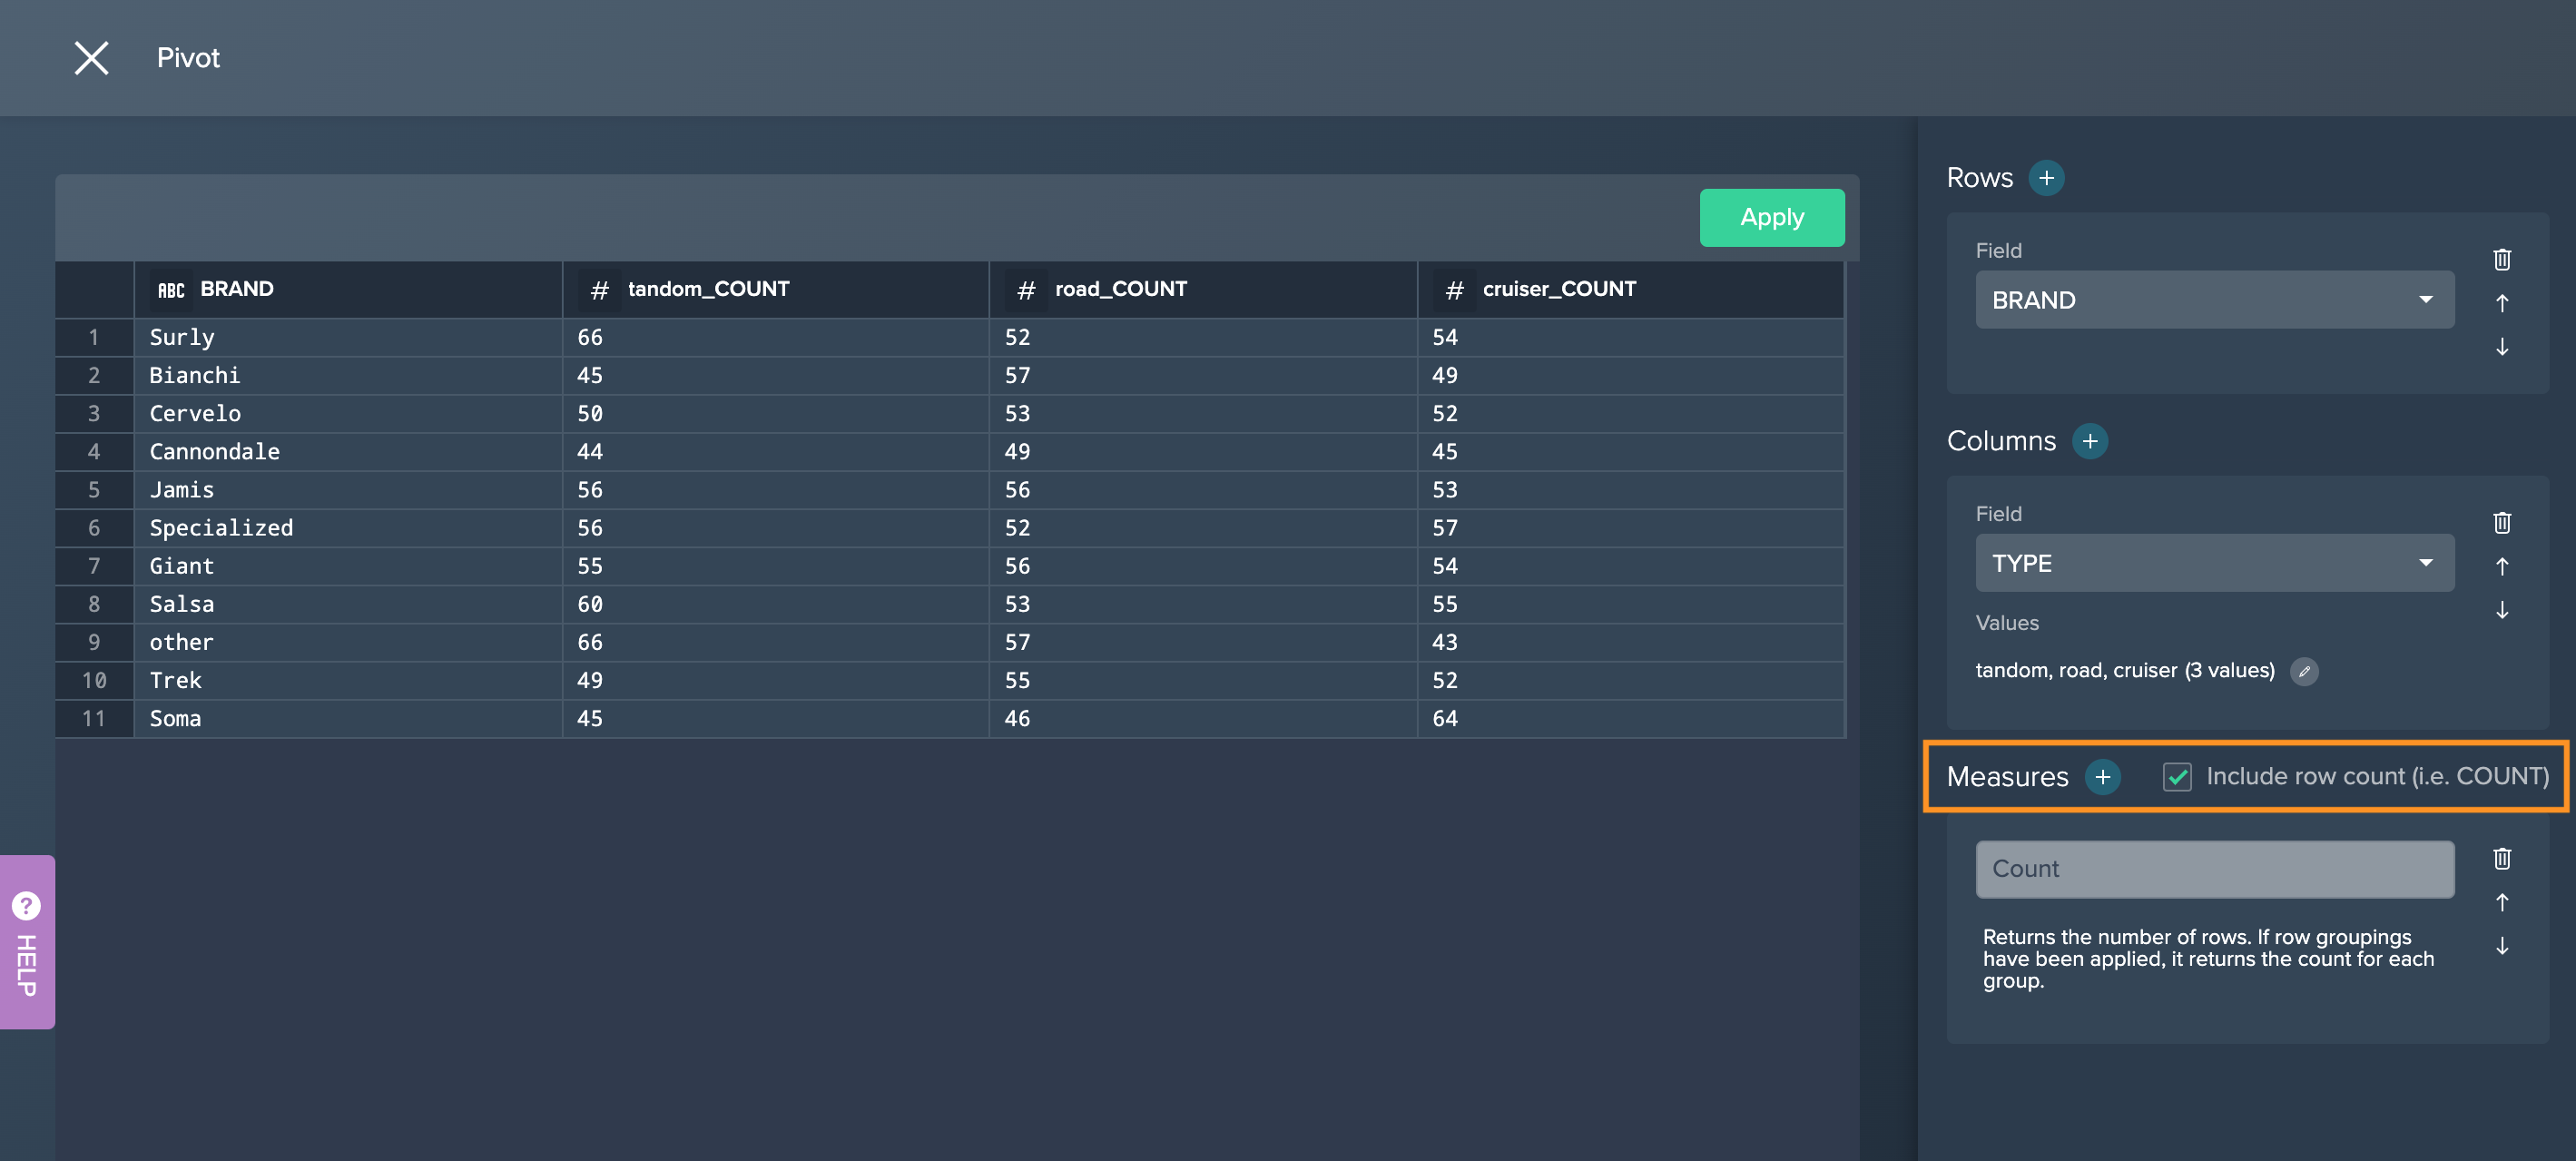
Select the measures or at least mark the checkbox "Include row count". Pivoting proceeds. The pivot table is displayed on the left.
-
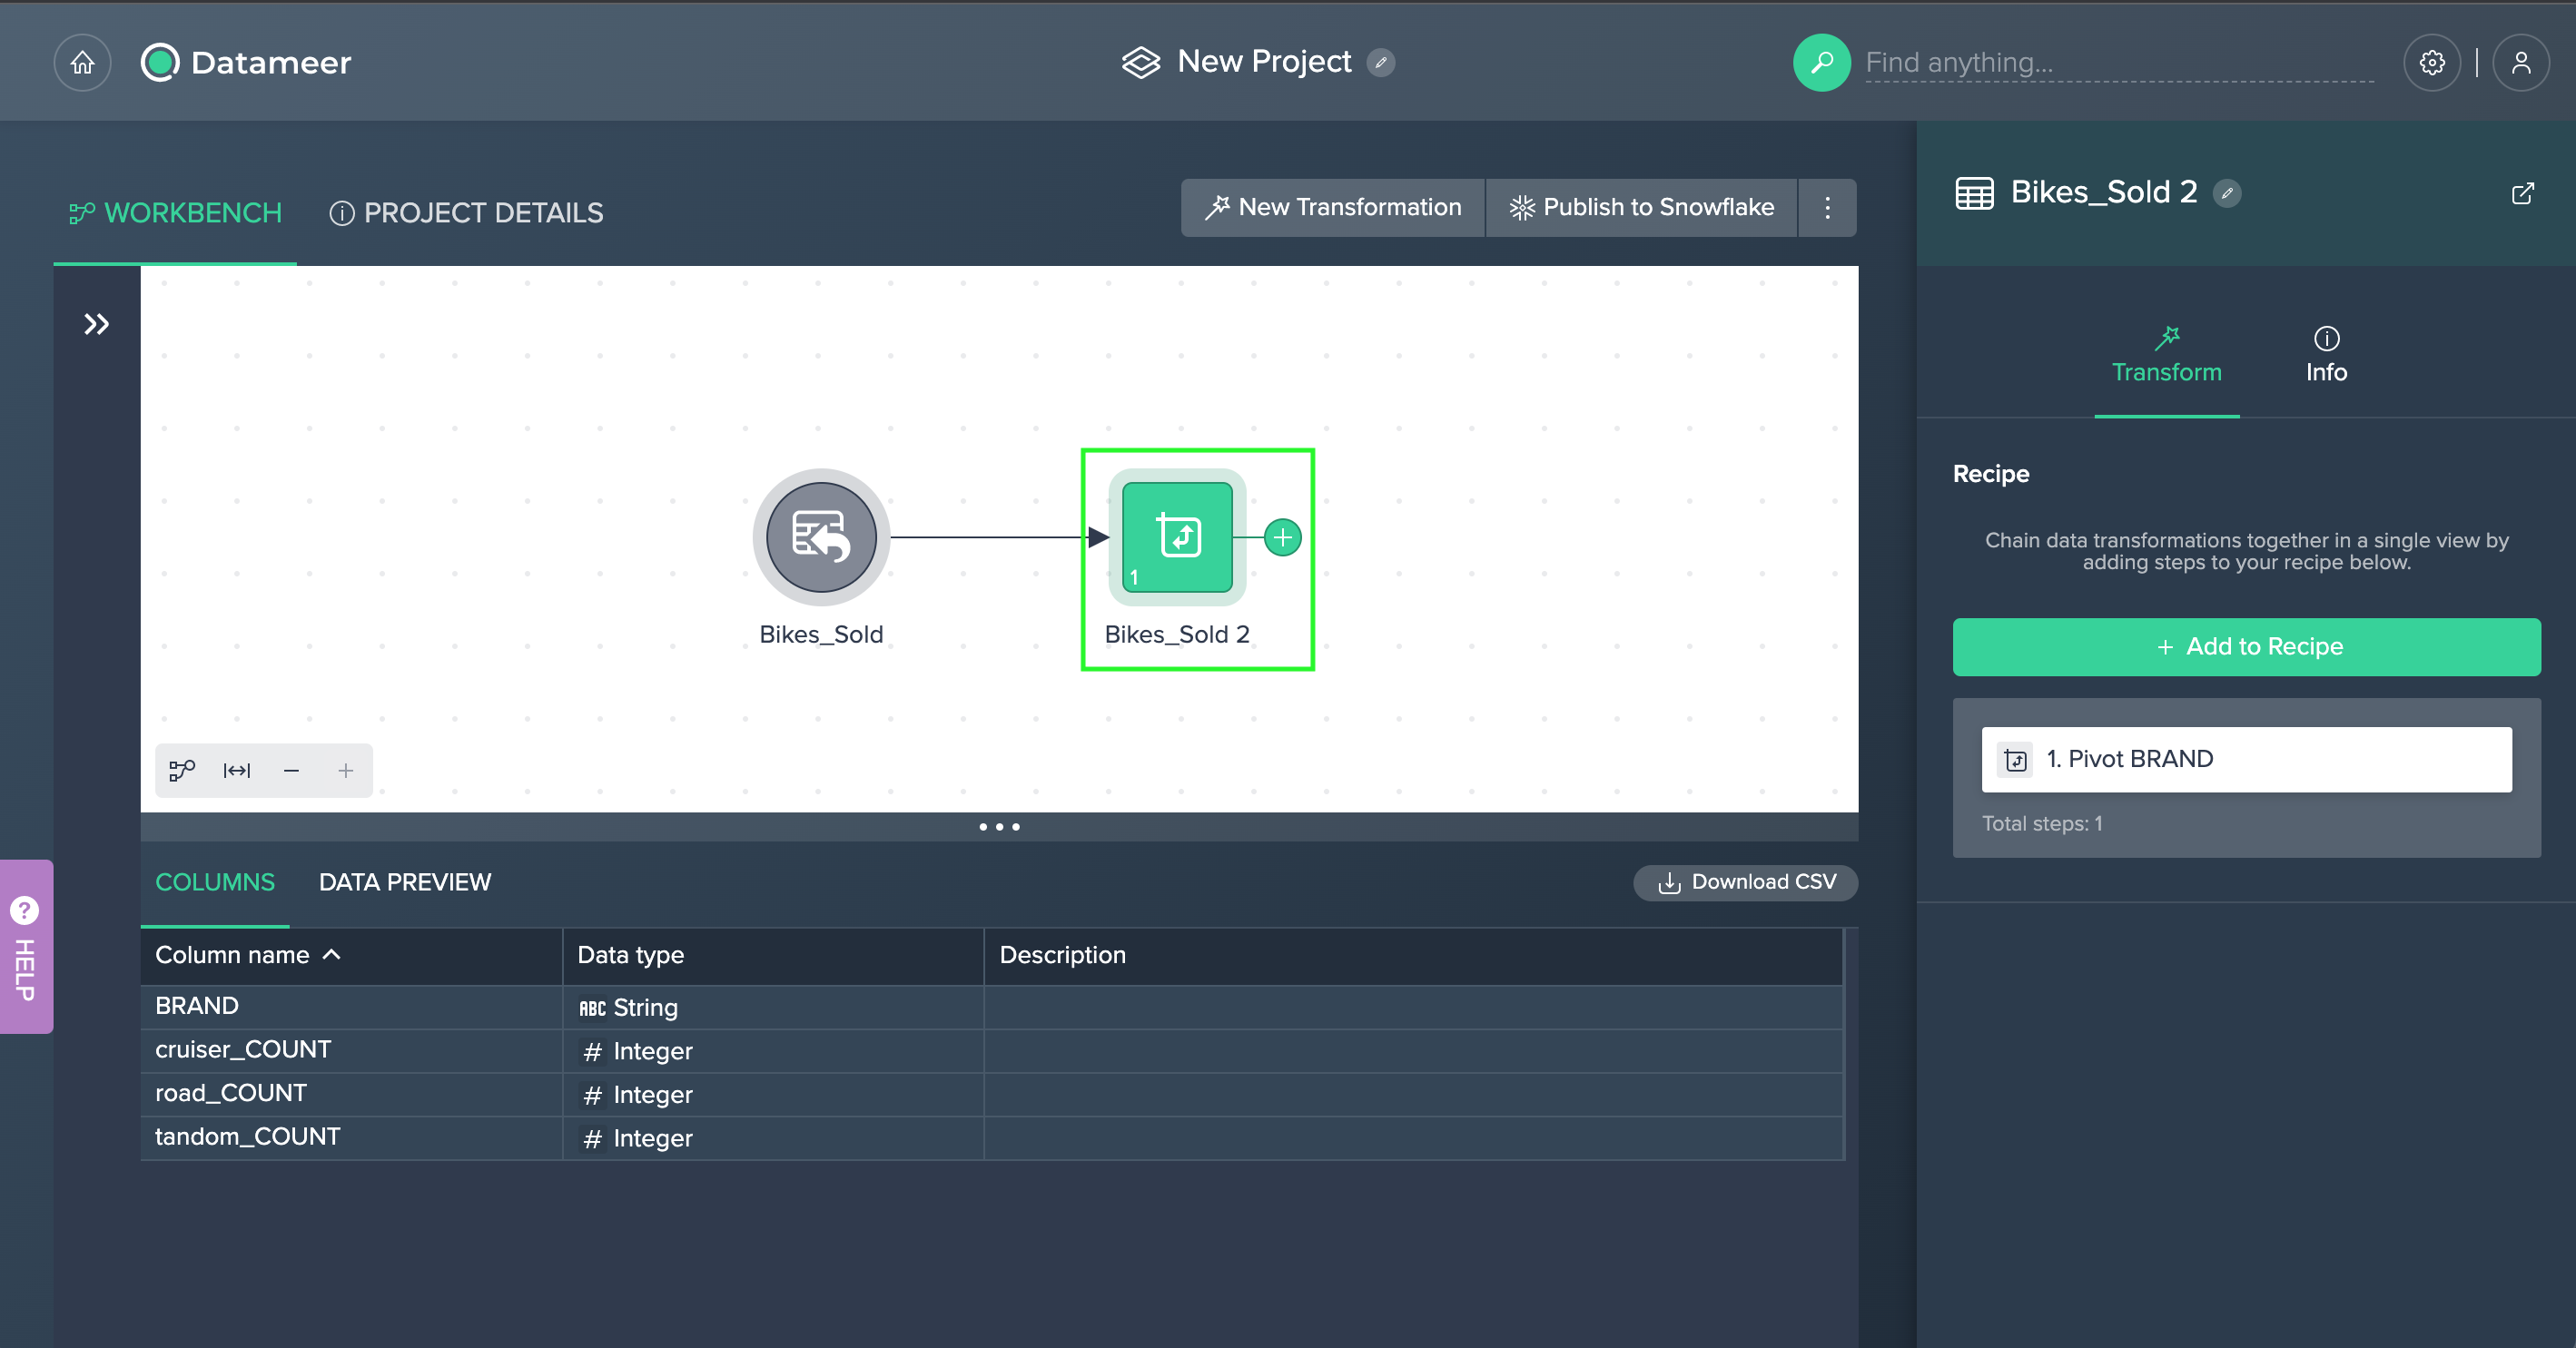
Click on "Apply". The new view is displayed in the Flow Area.
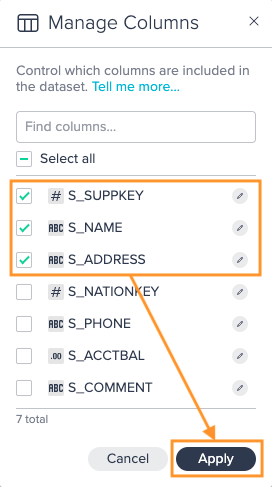
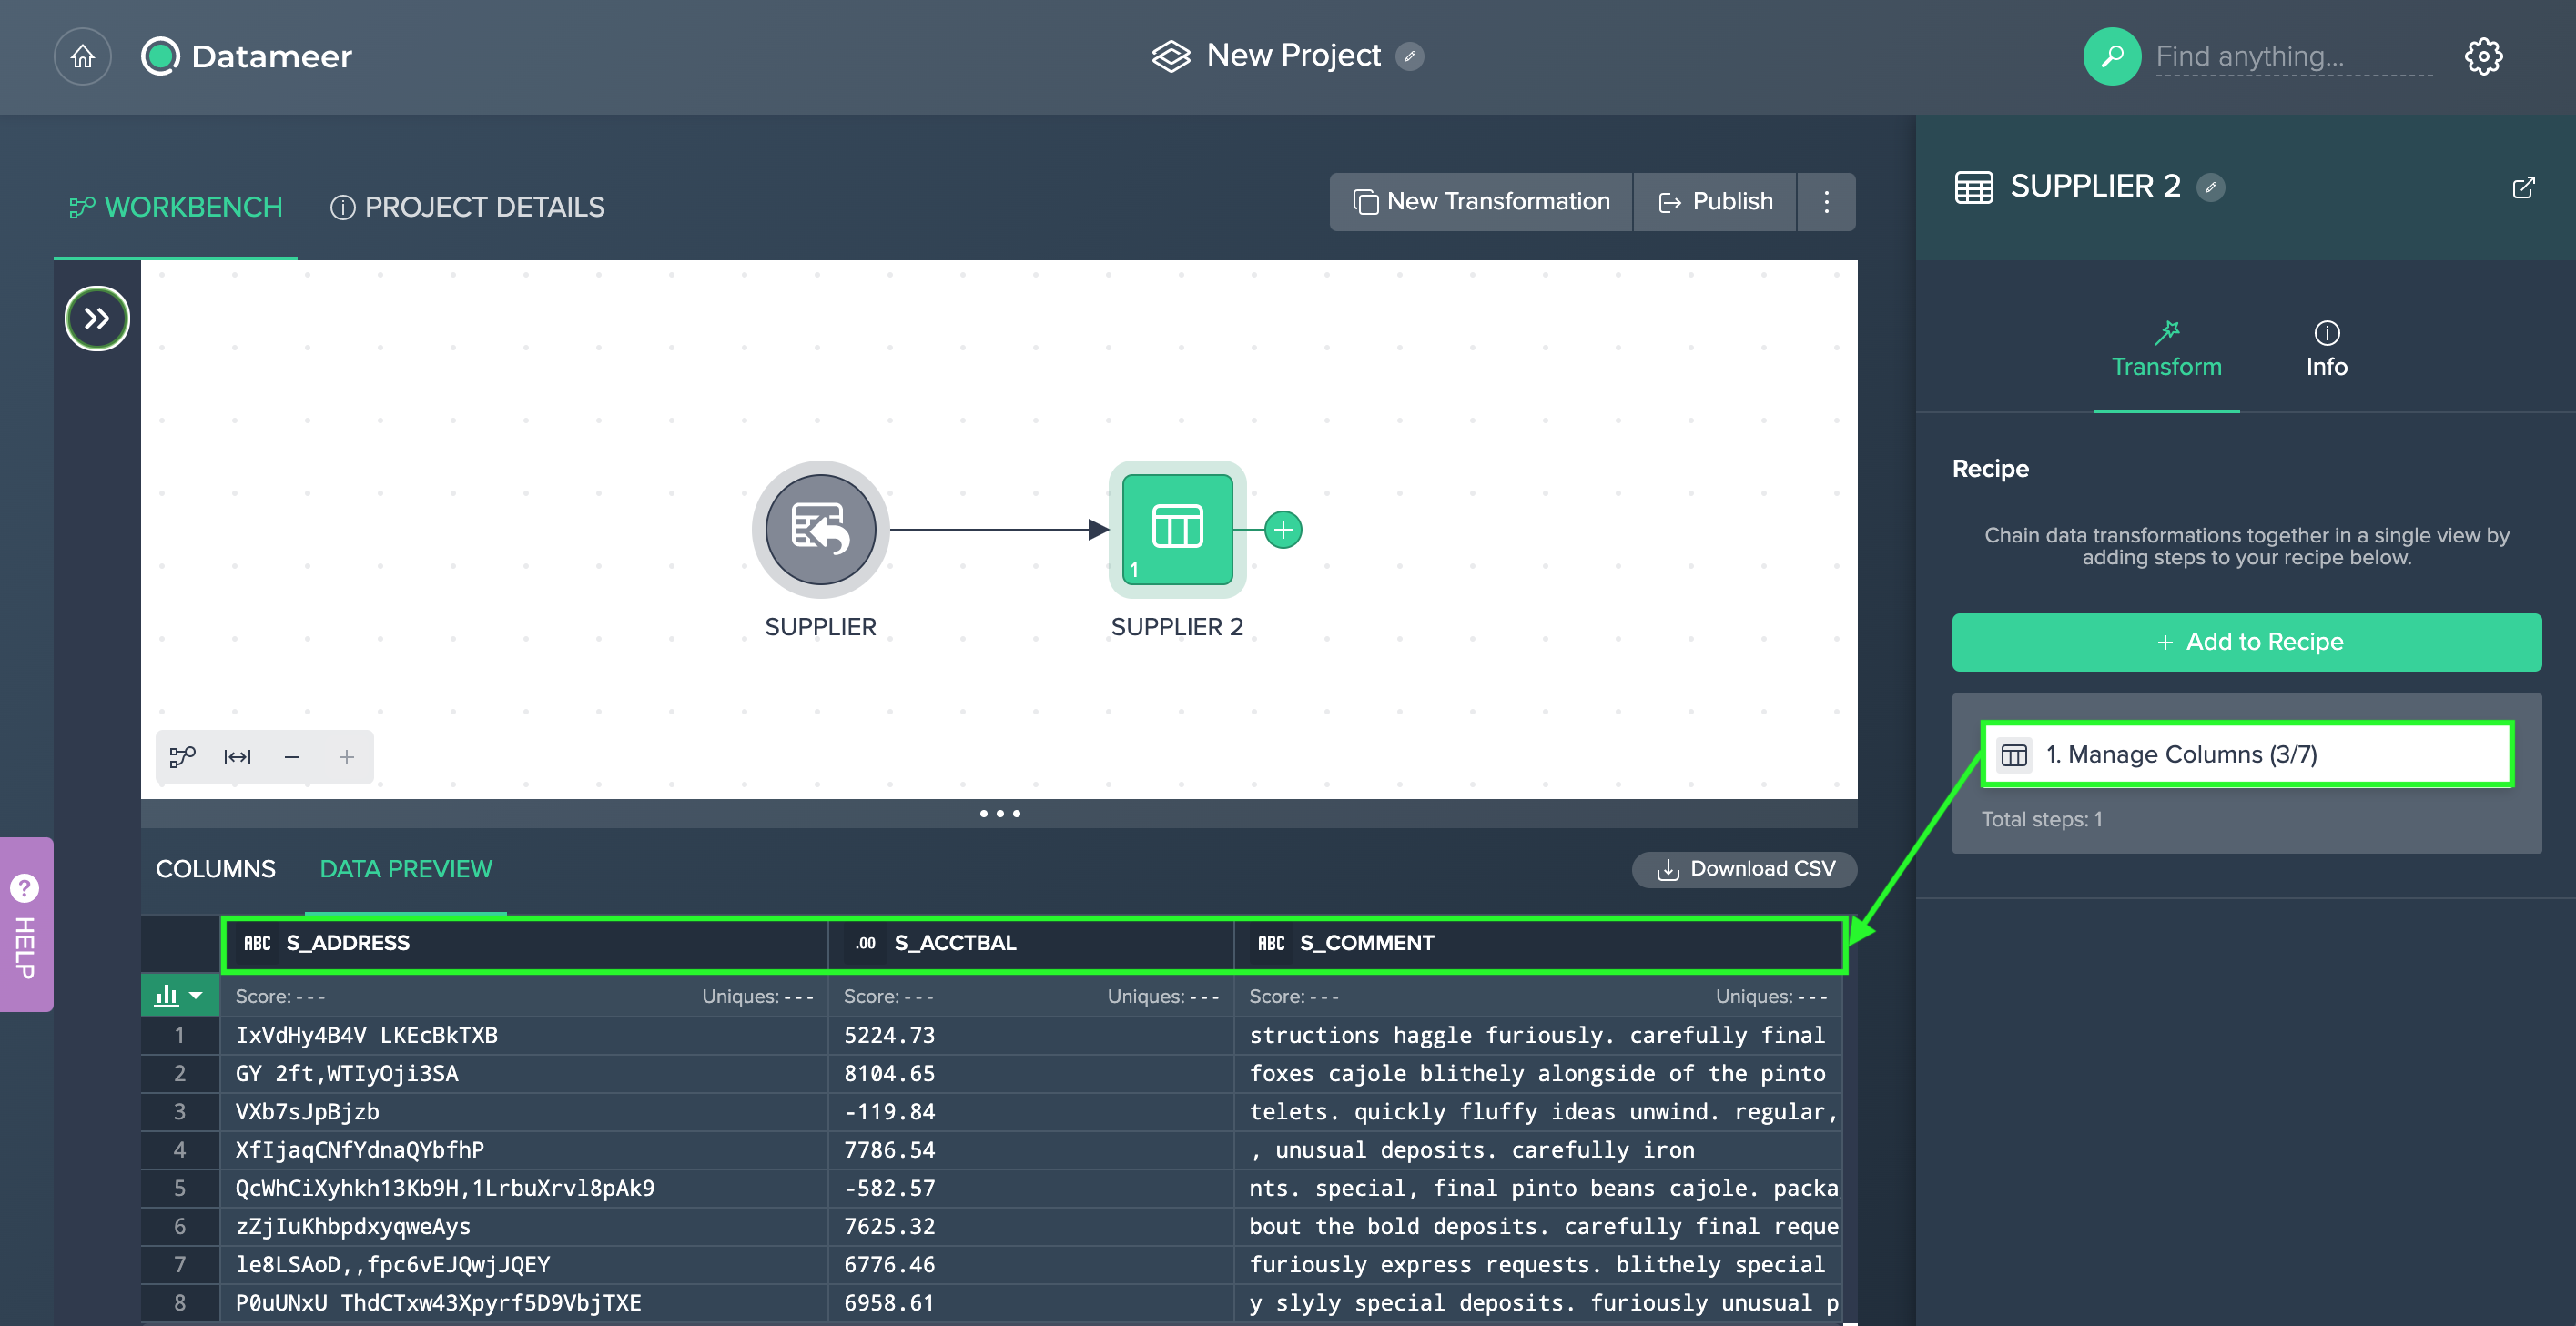
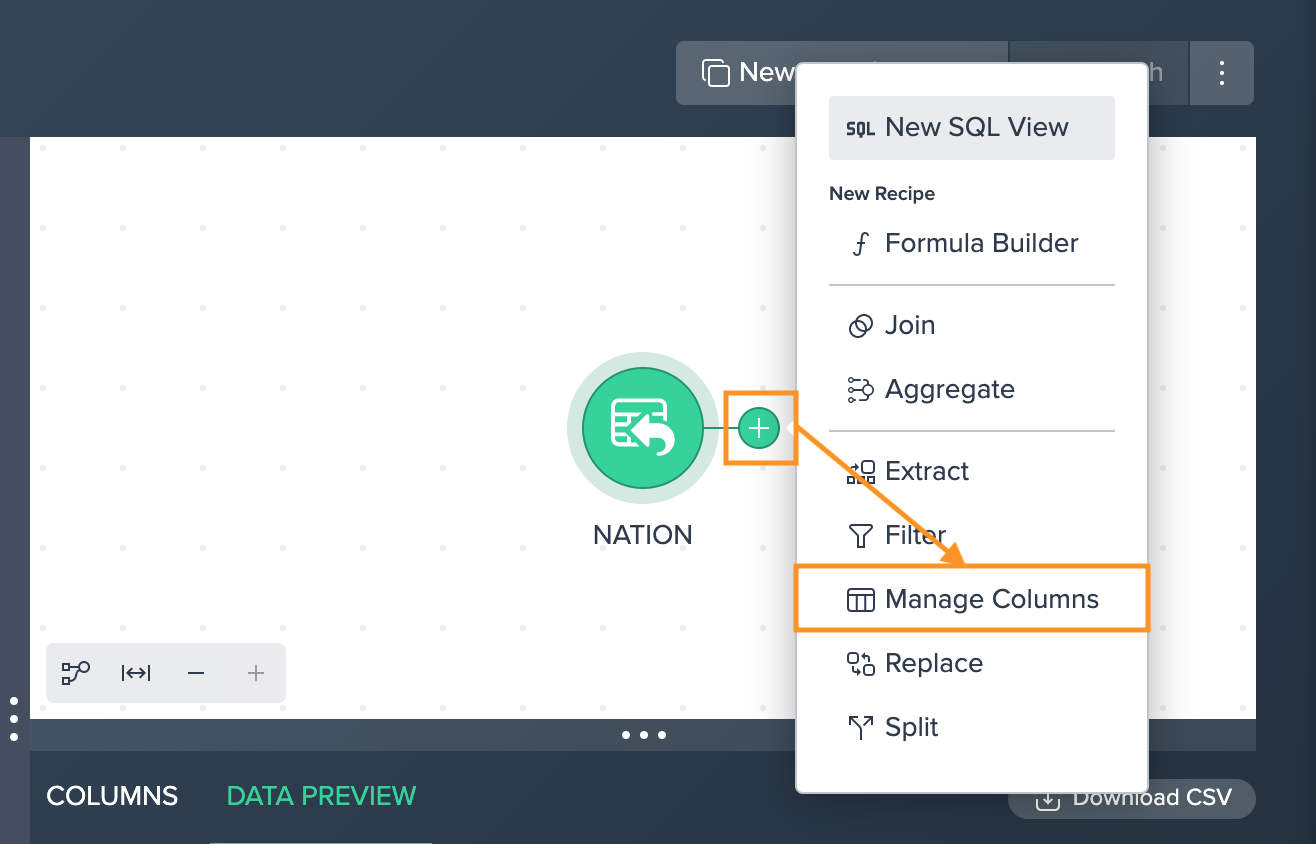
Manage Columns#
Use this operation to control which columns are included in the dataset.
The following applies:
- checked names are included, un-checked one are excluded
- all columns are checked by default
- the 'Find columns' search box at the top of the dialog filters the list of visible columns so you can quickly locate columns in large datasets
- un-check the 'Select all' box to uncheck all columns
- checking 'Select all' will re-select all columns
To manage columns:
-
Click on the "+" next to a dataset and select "Manage Columns". The operations configuration opens.
-
Select the columns, you want to include in the dataset and confirm with "Apply". The configuration applies. The column view is updated. The applied operation is listed in the 'Recipe' list