Beginner's Use Case
This page provides you a sample use case so you can see how Datameer basically works.
You will be guided through:
- Logging into Datameer
- Creating a new Project
- Adding tables/ data to a Project
- Performing a Join operation
- Performing an Aggregate operation
- Deploying the View/ Table to Snowflake
Logging into Datameer#
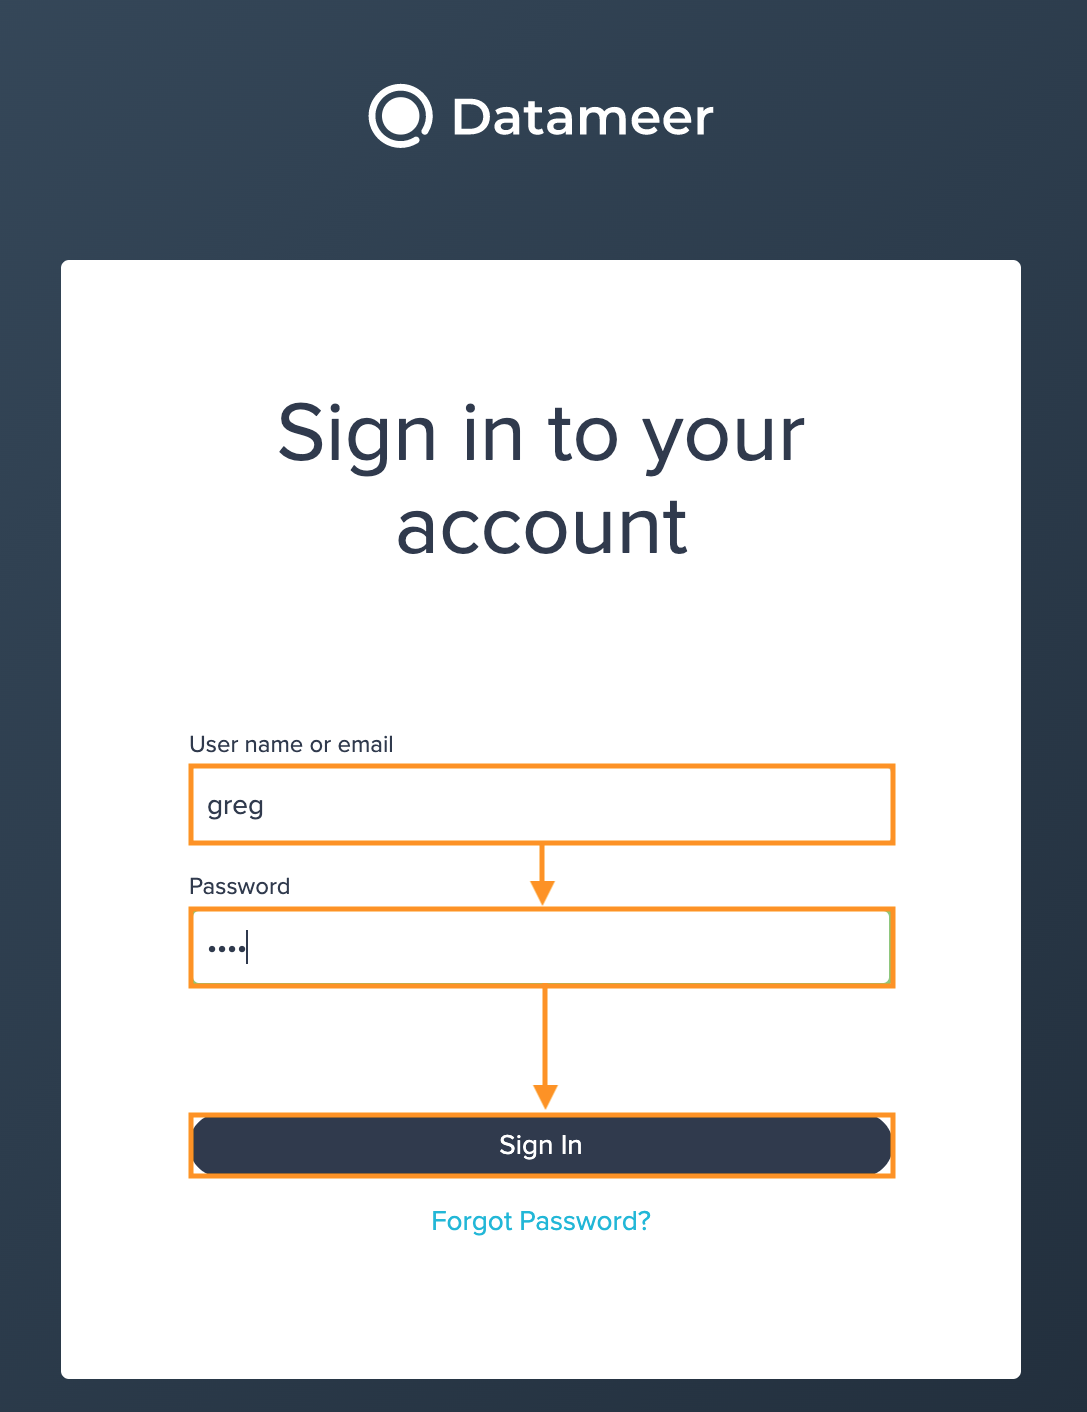
At the beginning we have to login to access our Datameer instance. We open a Browser, in our case Google Chrome, and enter our Datameer URL. We enter the "Username" or "Email" and "Password" and confirm with "Sign In".
Creating a New Project and Adding Data or Tables to the Project#
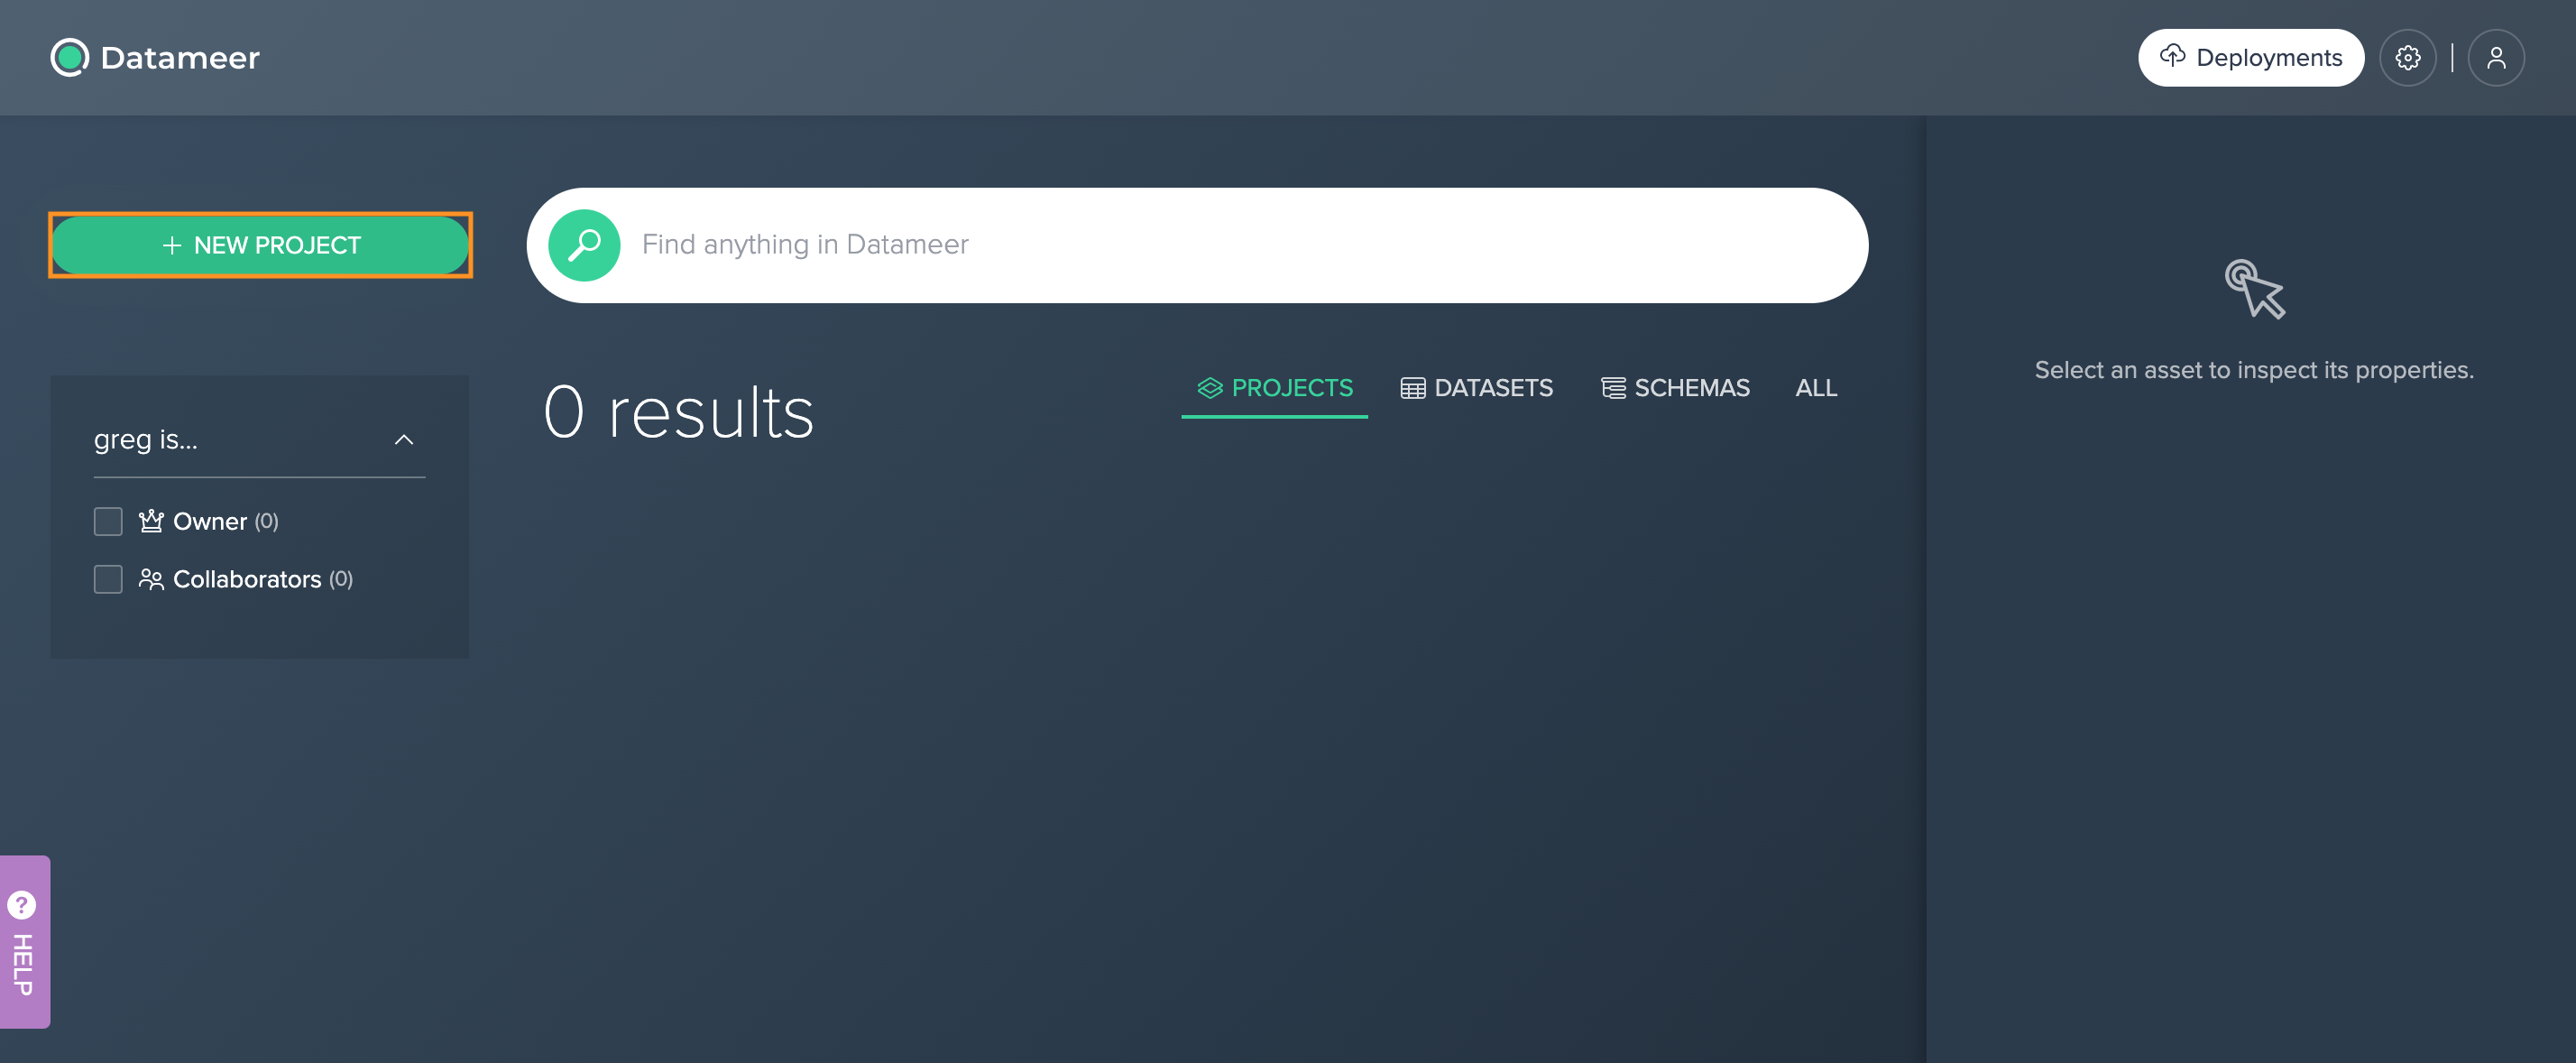
Since it is our first time using Datameer, the first step is to create a Project wherein we will add your Snowflake datasets and schemas and perform our transformations. After you have logged in, you are redirected to the Project Overview page and on there click the "+ NEW PROJECT" button to create a new Project.
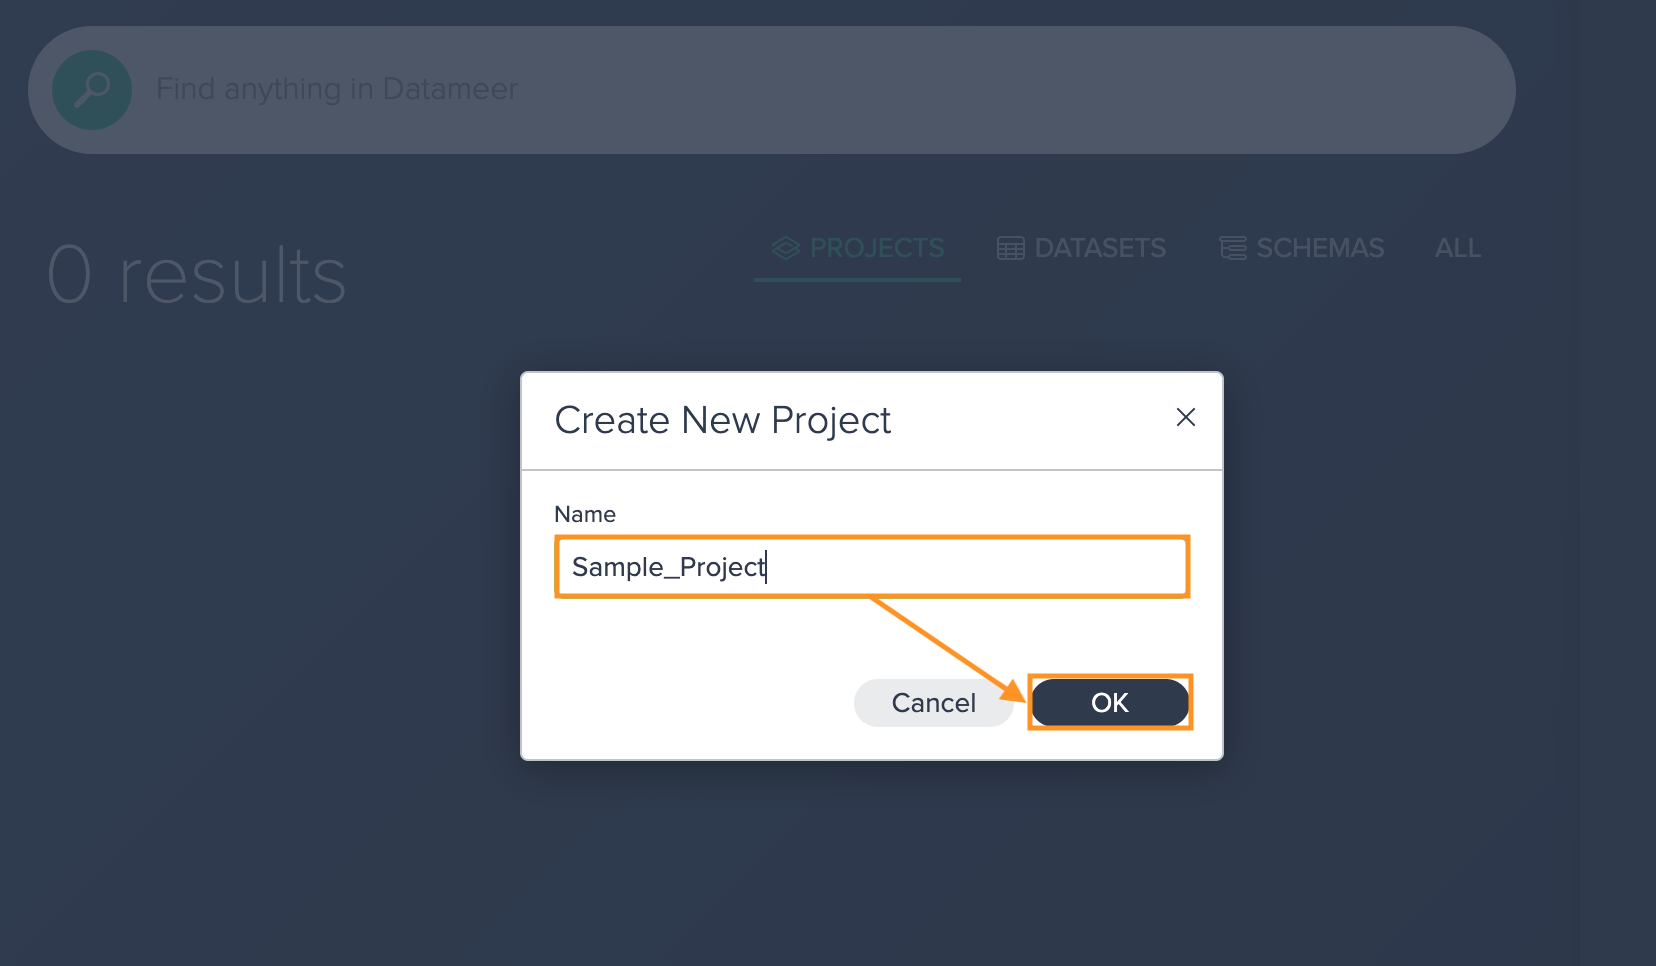
Then enter a suitable Project name and confirm with "OK".
What we now see is the Workbench of the created Project page with the Data Browser with all available data on the left and the Flow Area (without any data at this moment) in the middle.
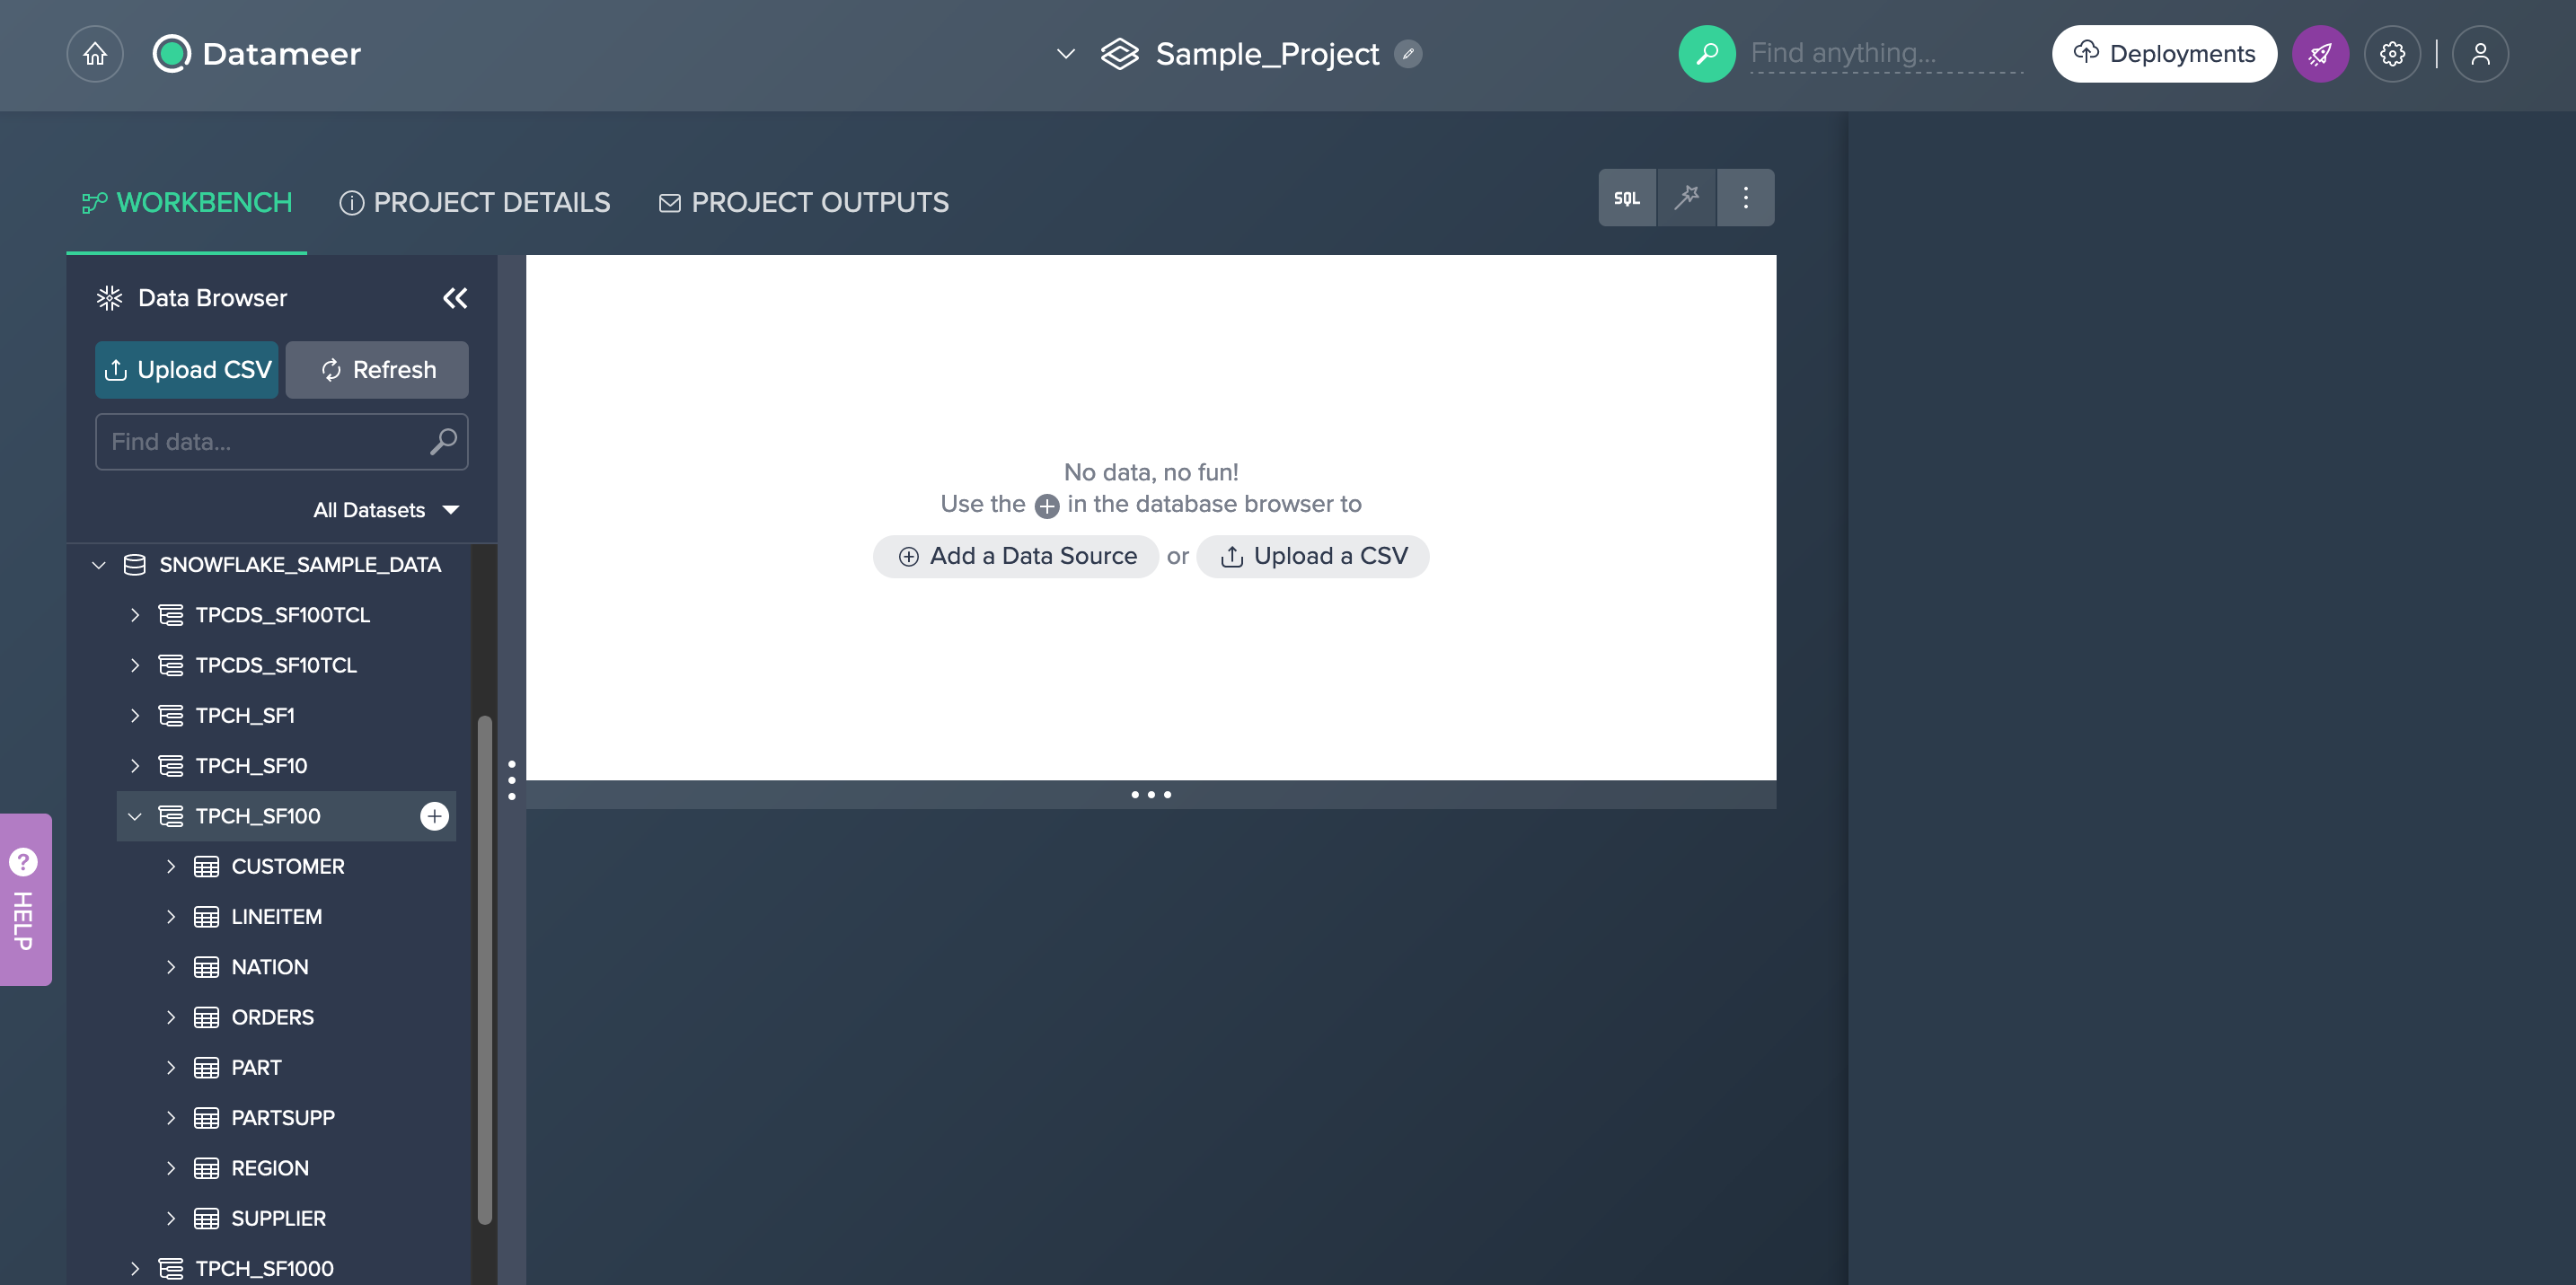
To add some data, we navigate through the Data Browser and add for our use case the 'NATION' table by clicking on the "+" next to the table name.
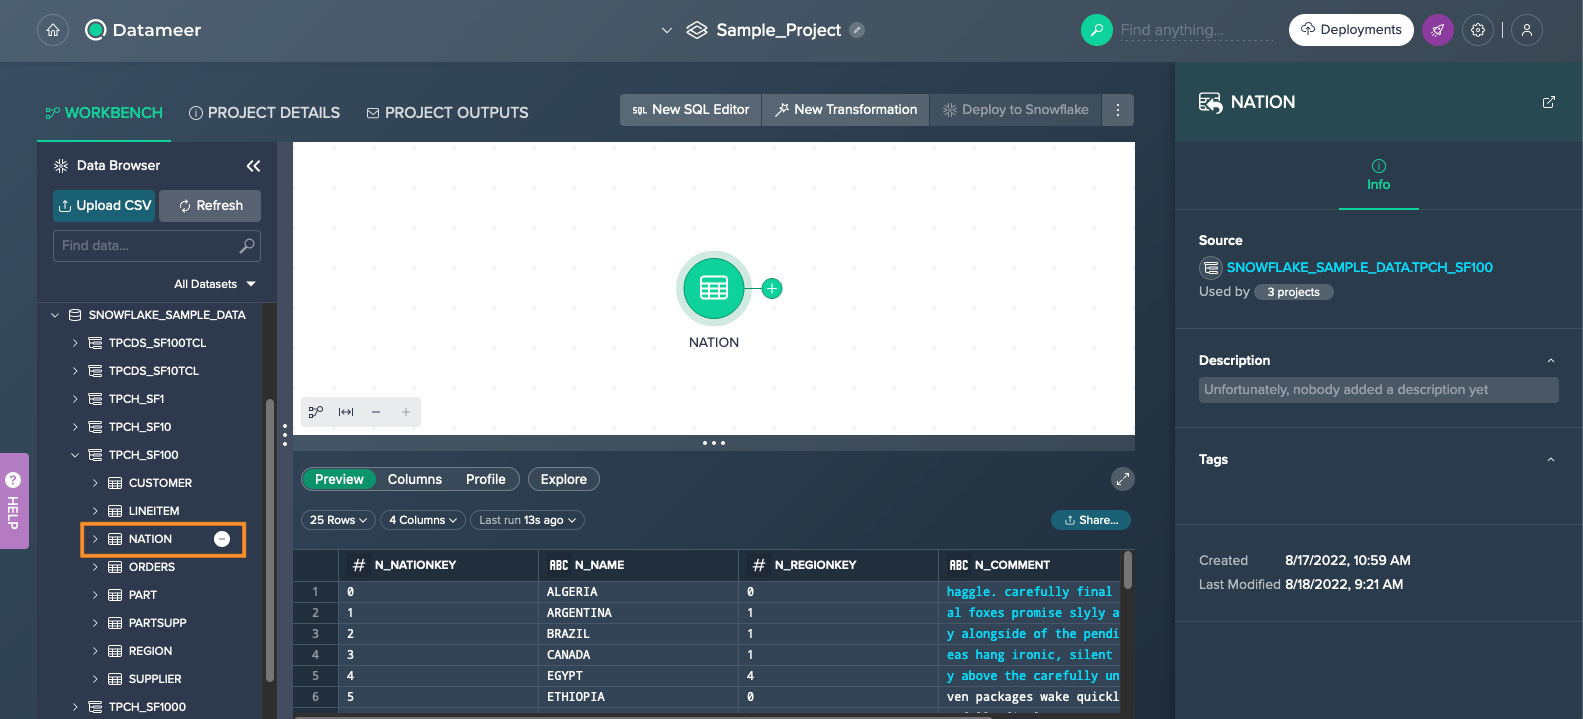
In general, you can add any data or table that is presented in the Data Browser. Once the data is added to the Project and therefore added to the Flow Area, you can remove it again, e.g. via the context menu or by clicking "-" next to the data name in the Data Browser. The Inspector on the right side presents several information about the dataset, that is marked in the Flow Area.
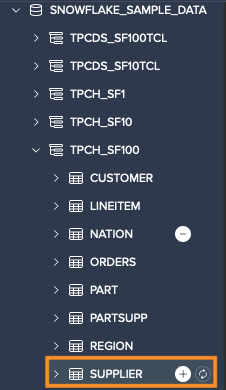
Let's now start to perform our first transformation. For that, we add the 'SUPPLIER' dataset by clicking the "+" in the Data Browser.
Performing the Join Operation#
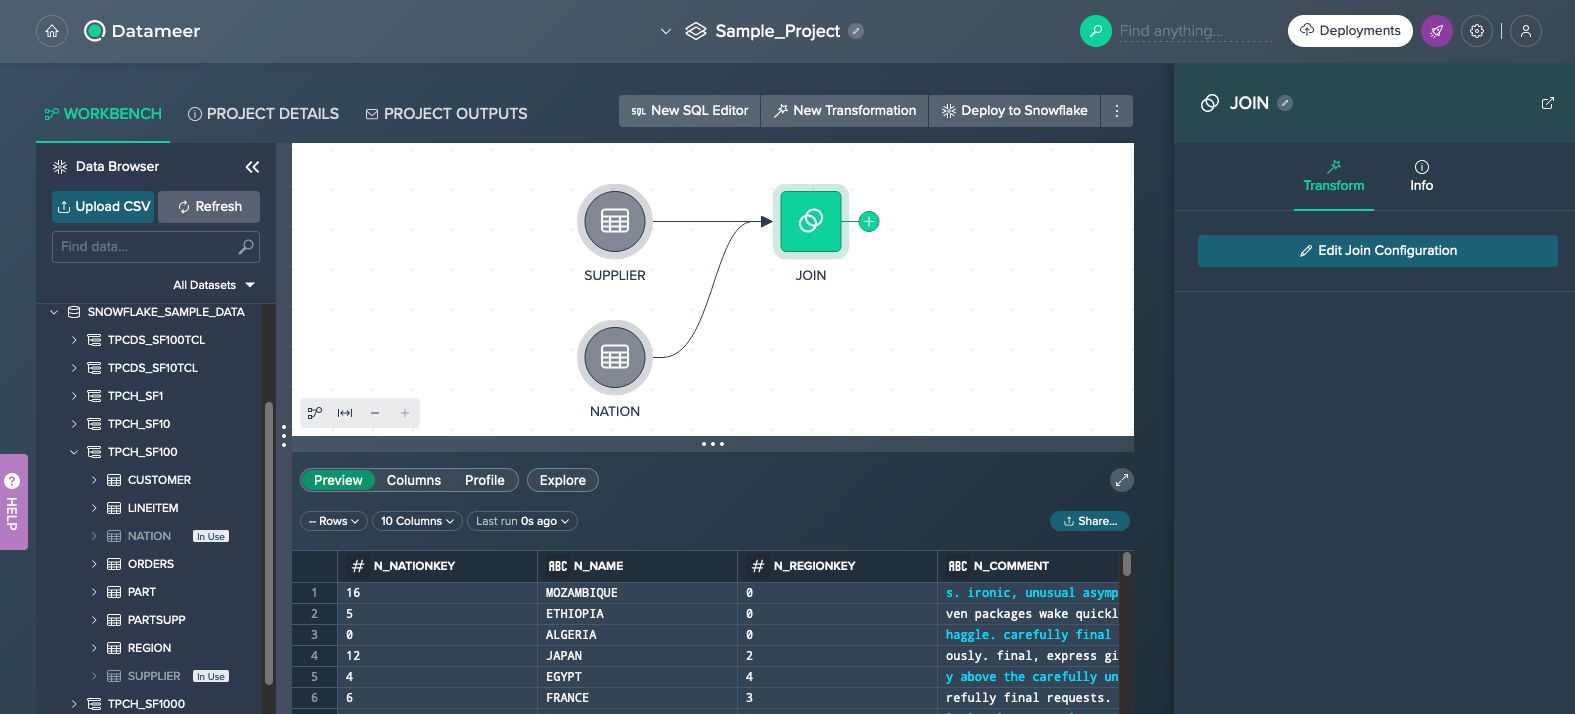
Our goal for the first transformation in this sample use case is to join both source datasets 'NATION' and 'SUPPLIER' by their 'NATIONKEY' columns.
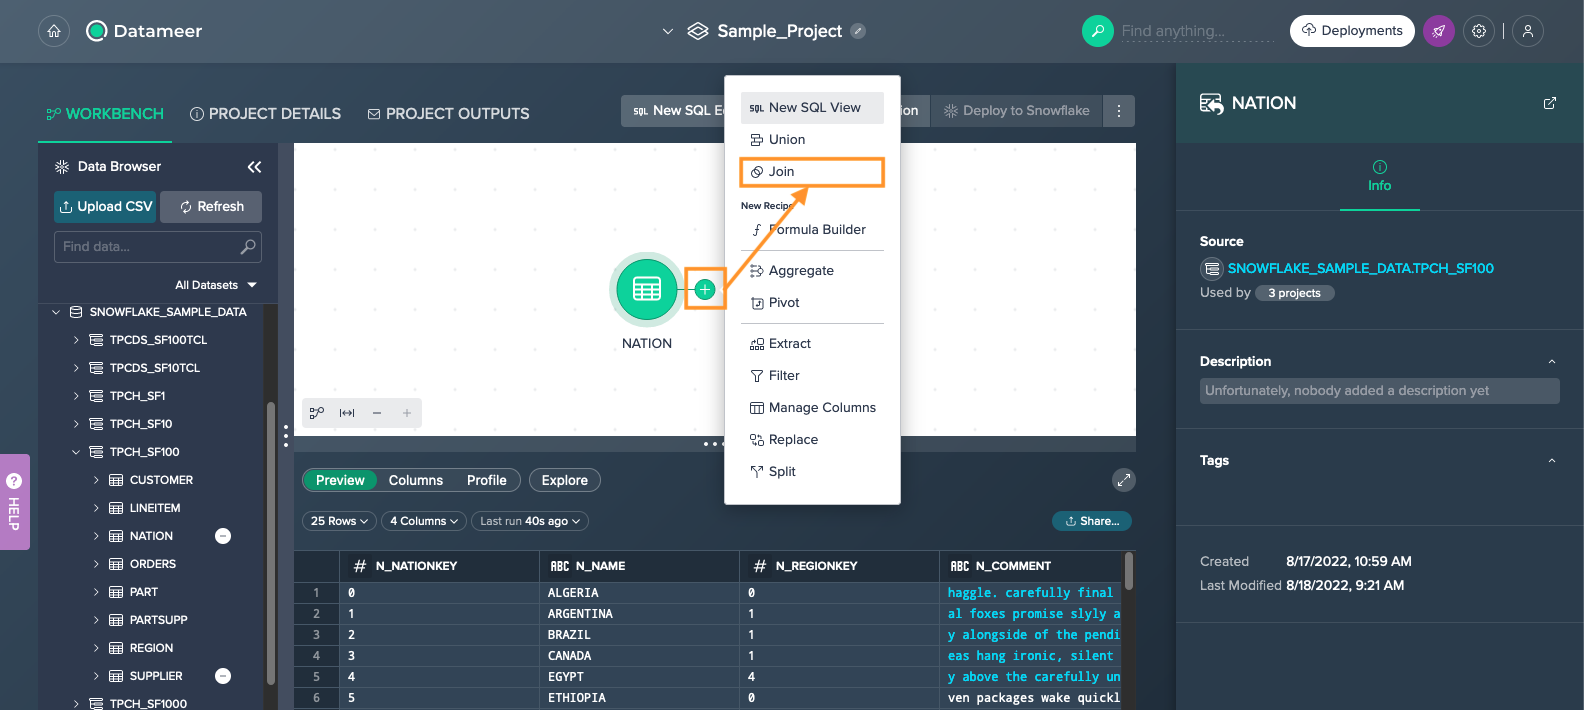
First we click on the "+" icon of the 'NATION' source and select the light data preparation operation "Join". The 'Join Configuration' view opens.
On the left side the data preview for the source is displayed. On the right side, we can configure the Join operation.
We have already selected 'NATION' as the first source. That's why it appears on the left 'Sources' side and we need to select the second source from the dropdown on the right side next. The dropdown provides the 'SUPPLIER' dataset and we select it.
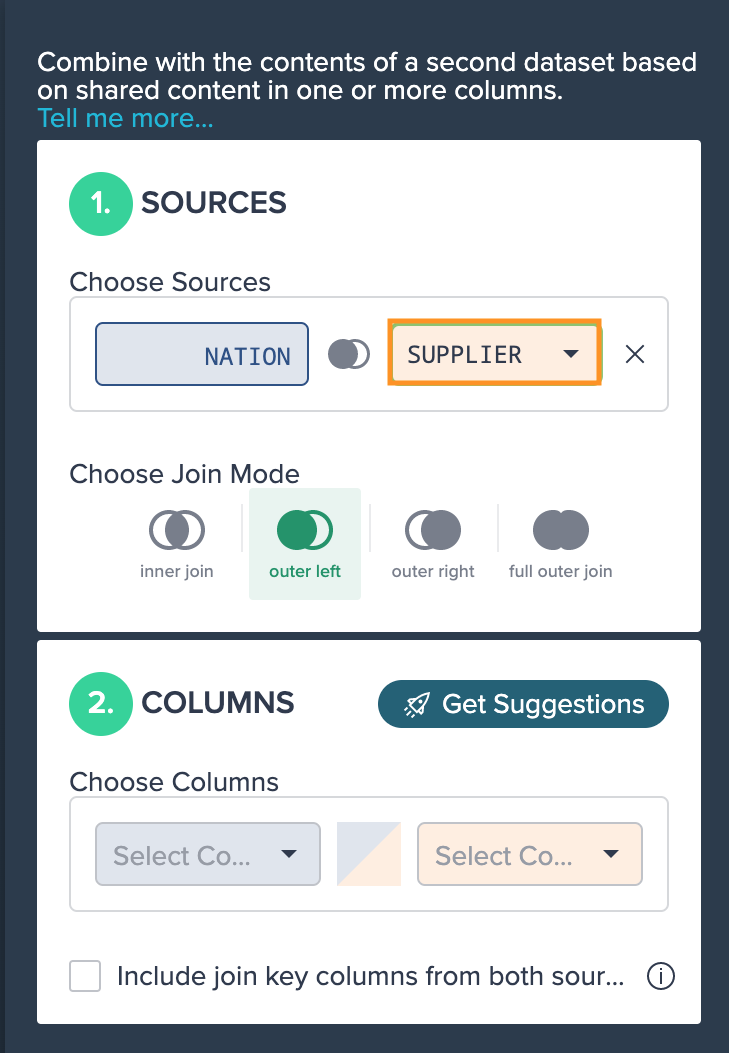
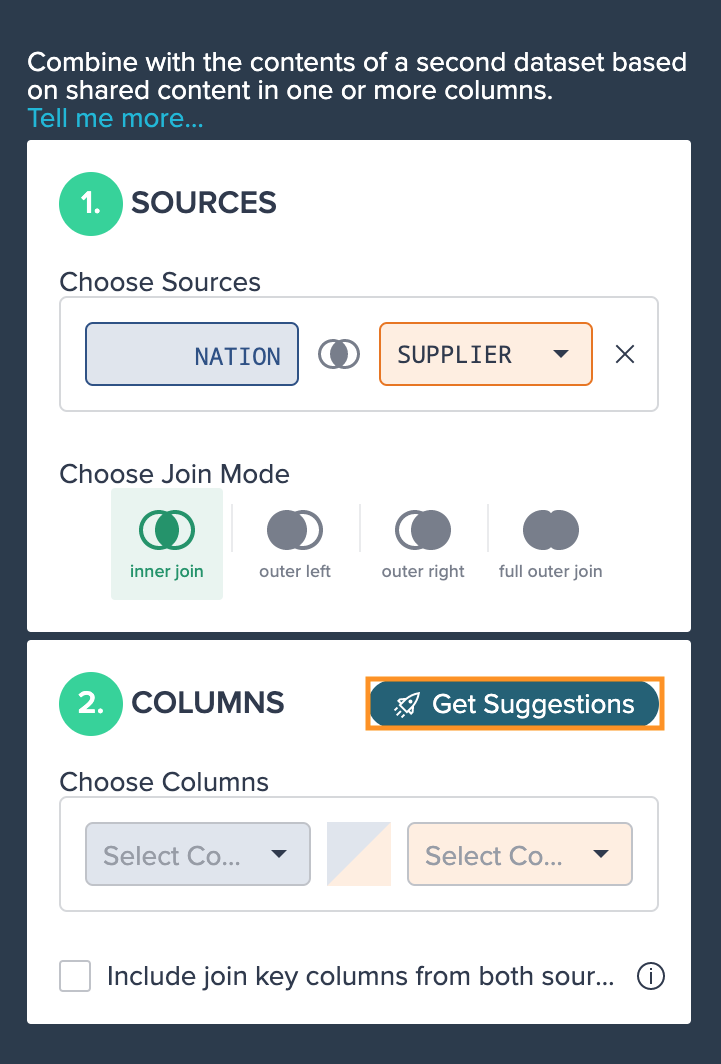
Next, select the Join mode "inner join".
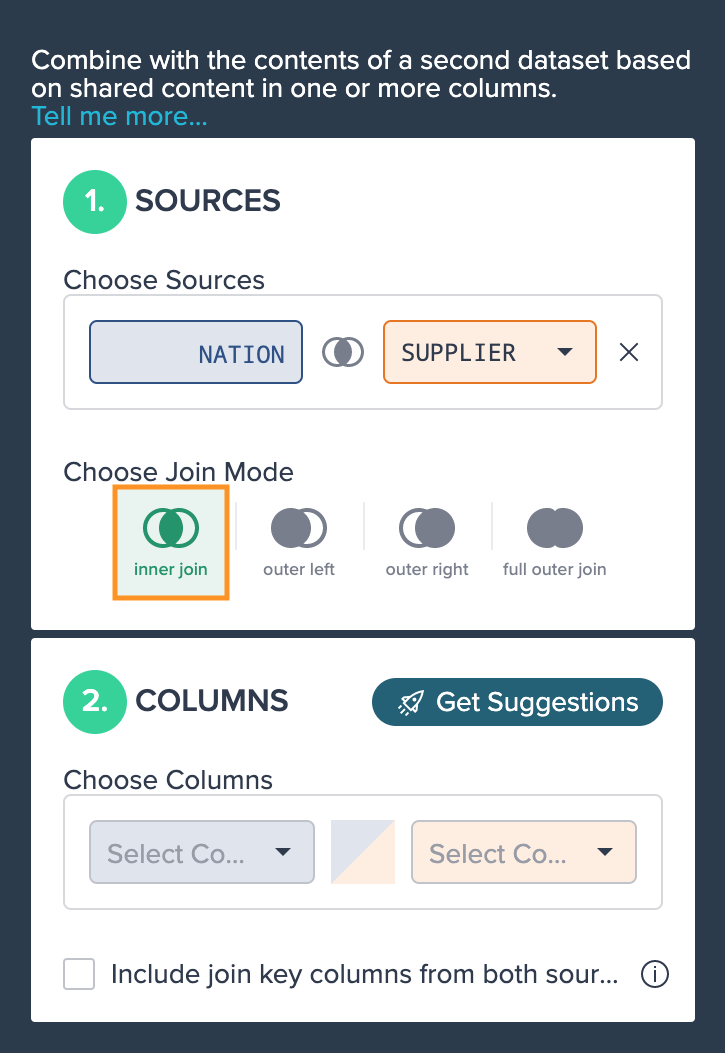
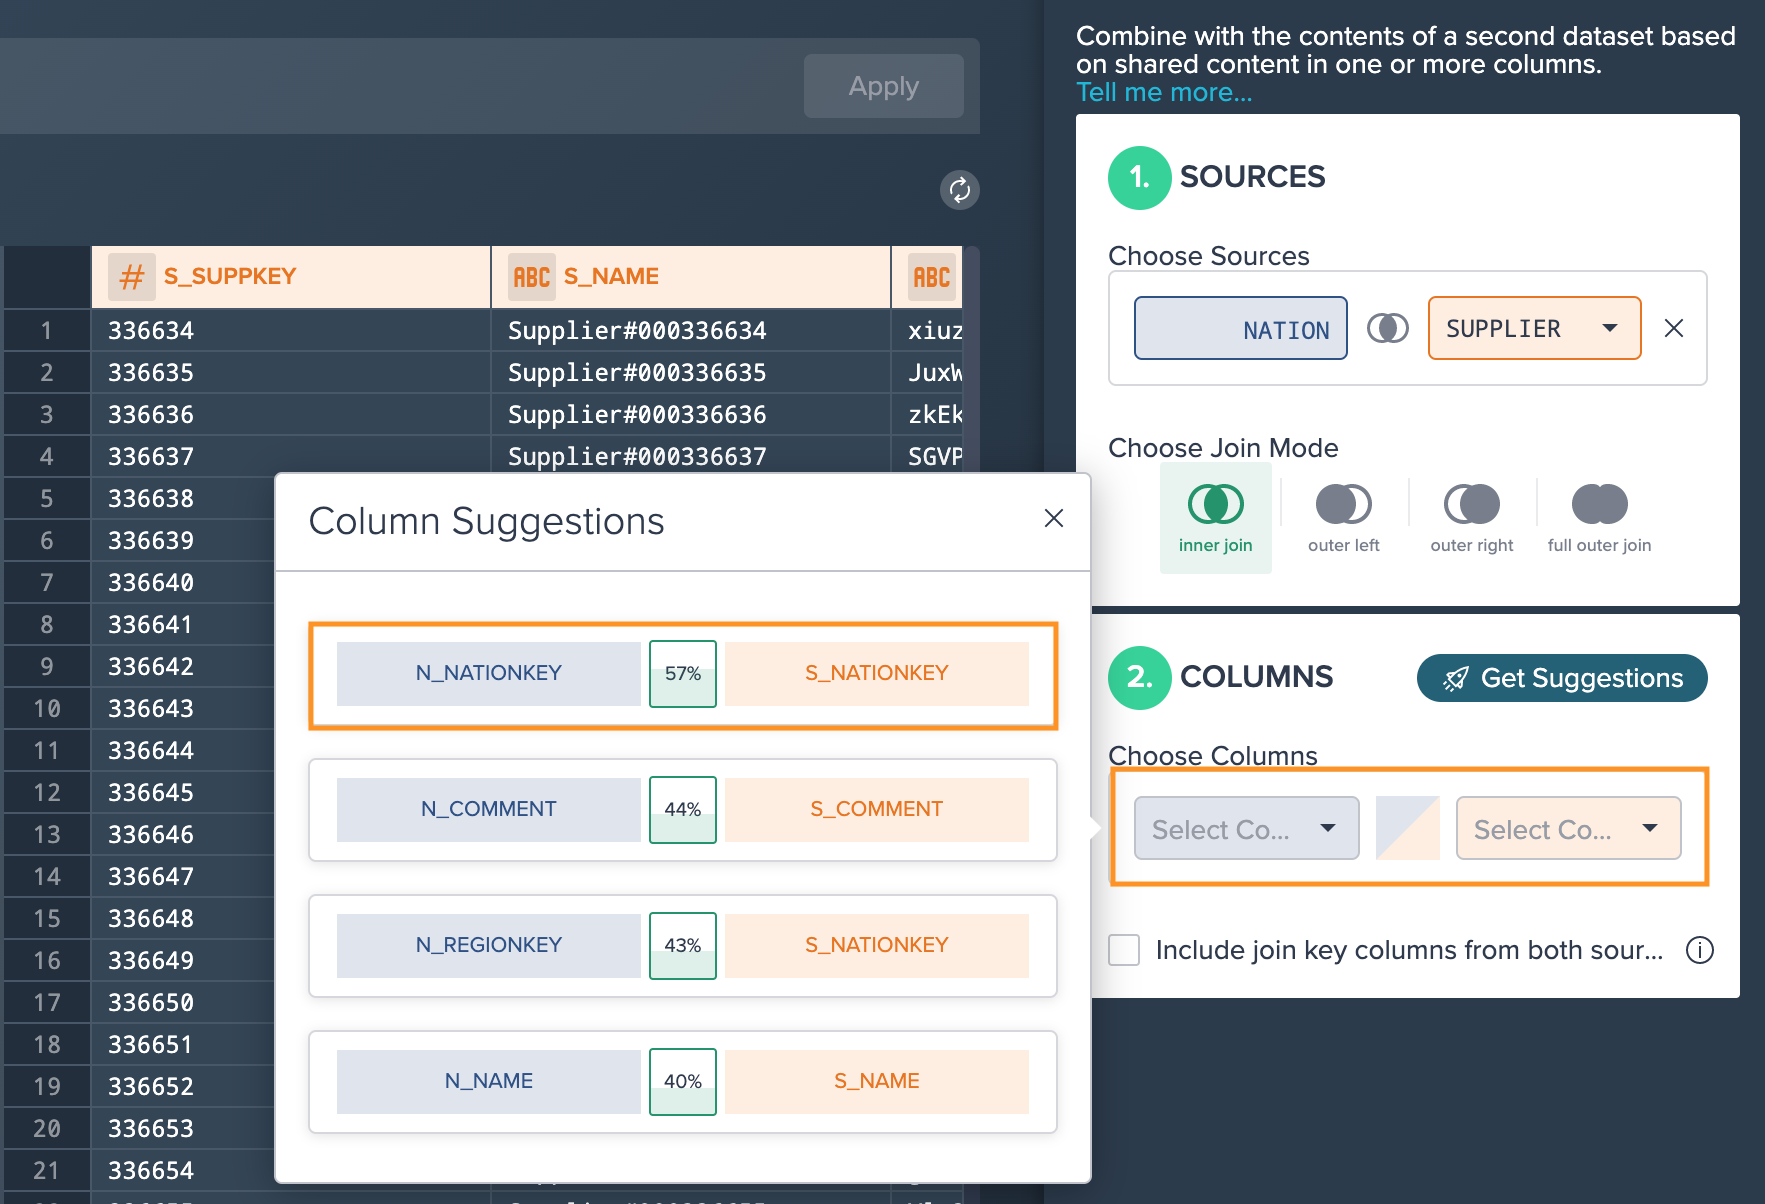
Now we have two options: We can click on the 'Get Suggestions' button to view appropriate suggestions and select the columns or we can select the columns manually from the 'COLUMNS' section on the right side. When clicking "Get Suggestions", the best matches for joining both datasets are calculated and after a short time displayed.
After assigning the required columns, confirm the configuration with "Apply".
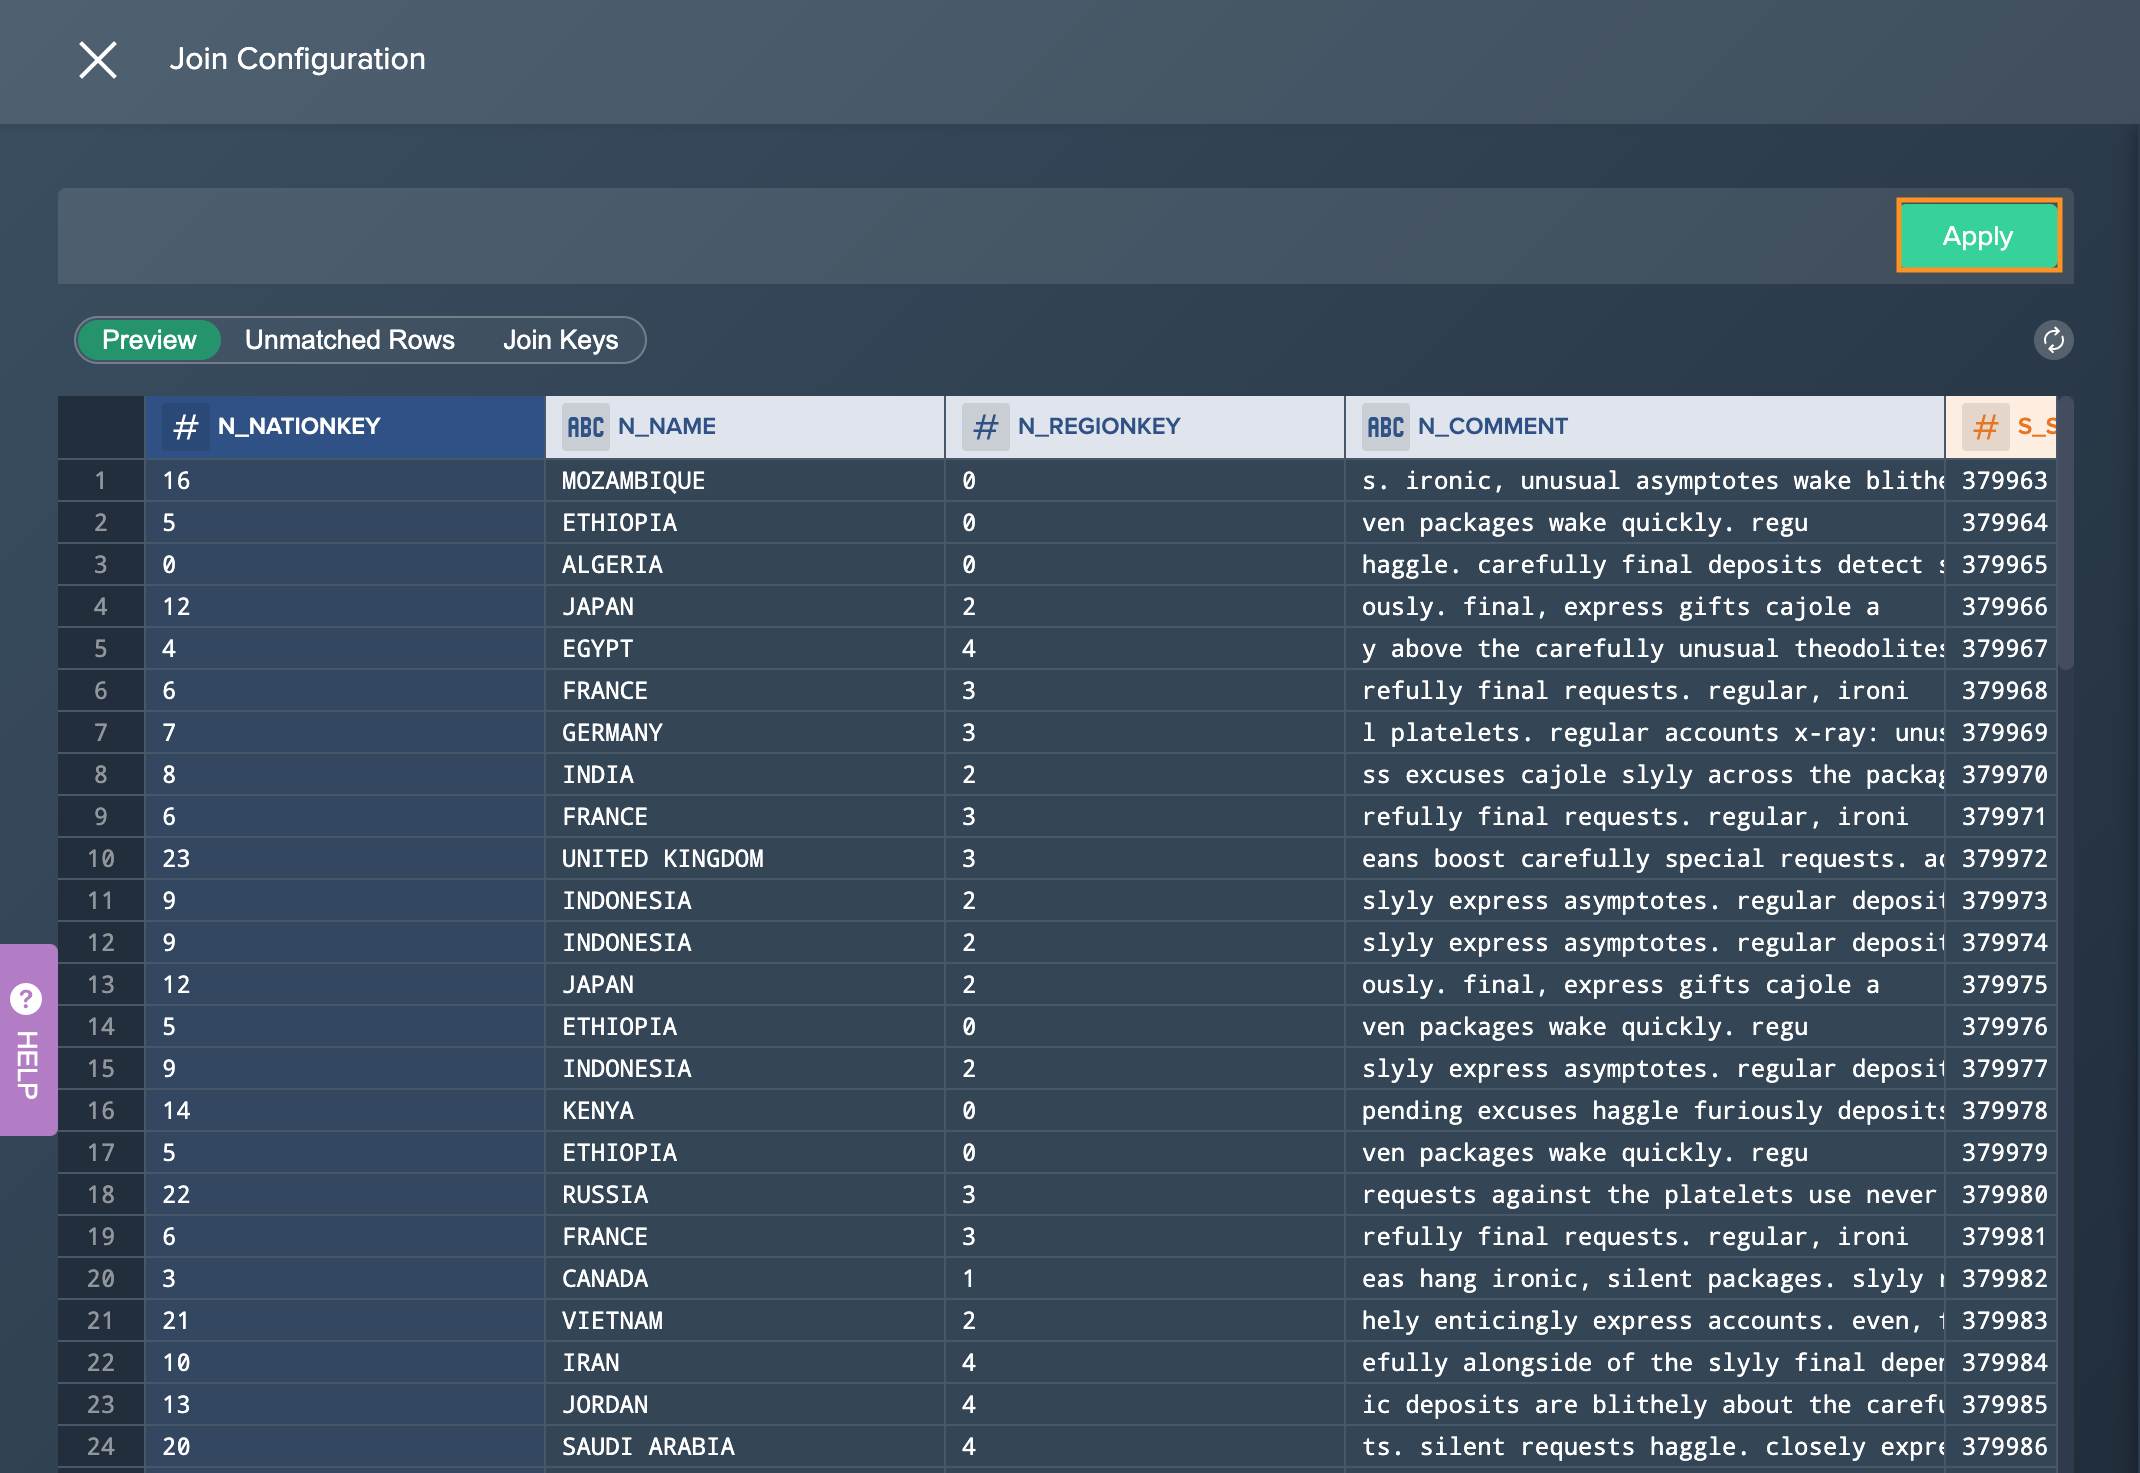
Finally, we are guided back to the Project's Workbench and view and explore our 'JOIN' view. Both Join sources are connected to the new view with arrow lines. Viewing the new Datameer view in a highlighted square means that an operation has been applied. The Data Grid provides information like the 'Preview', 'Columns' and 'Profile'. On the right side we can edit already applied operations.
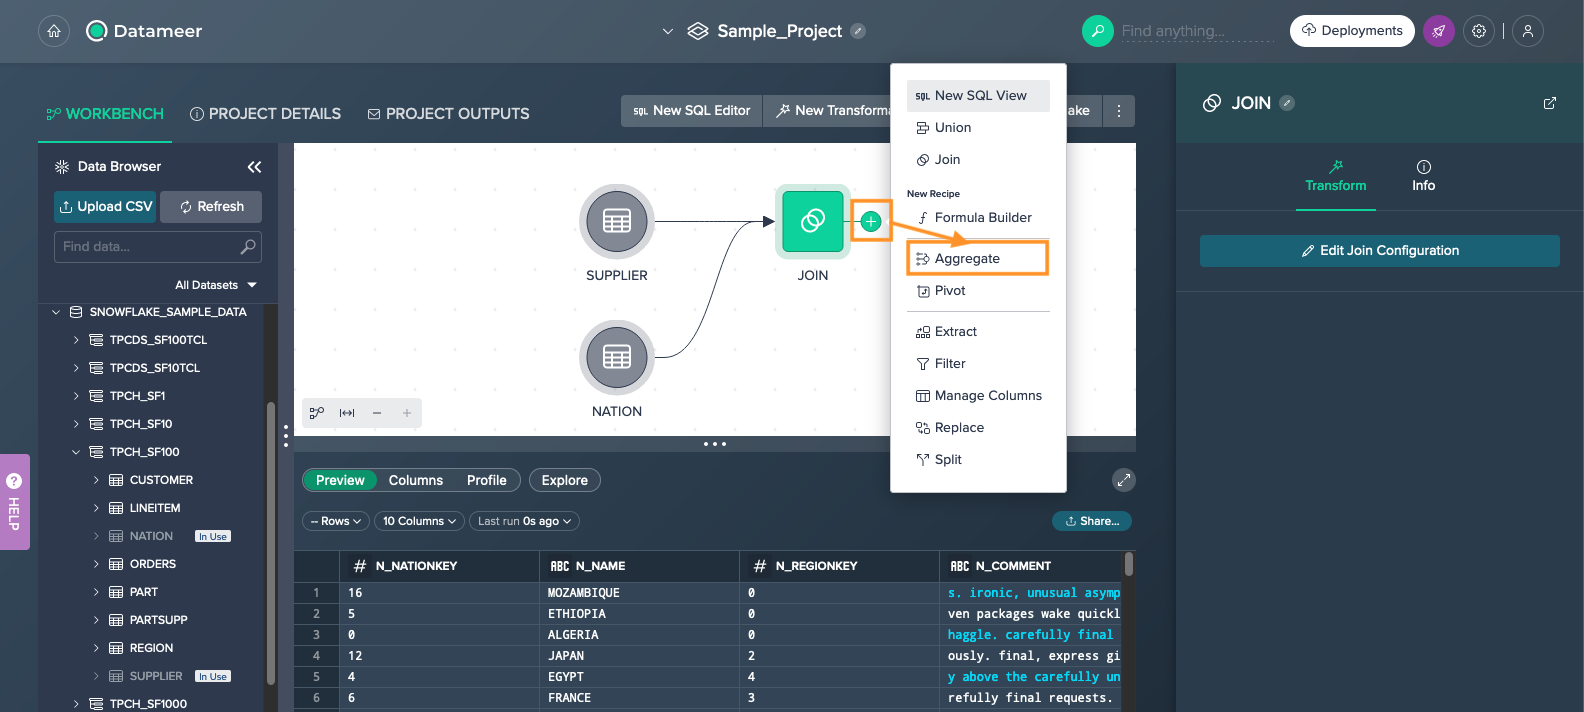
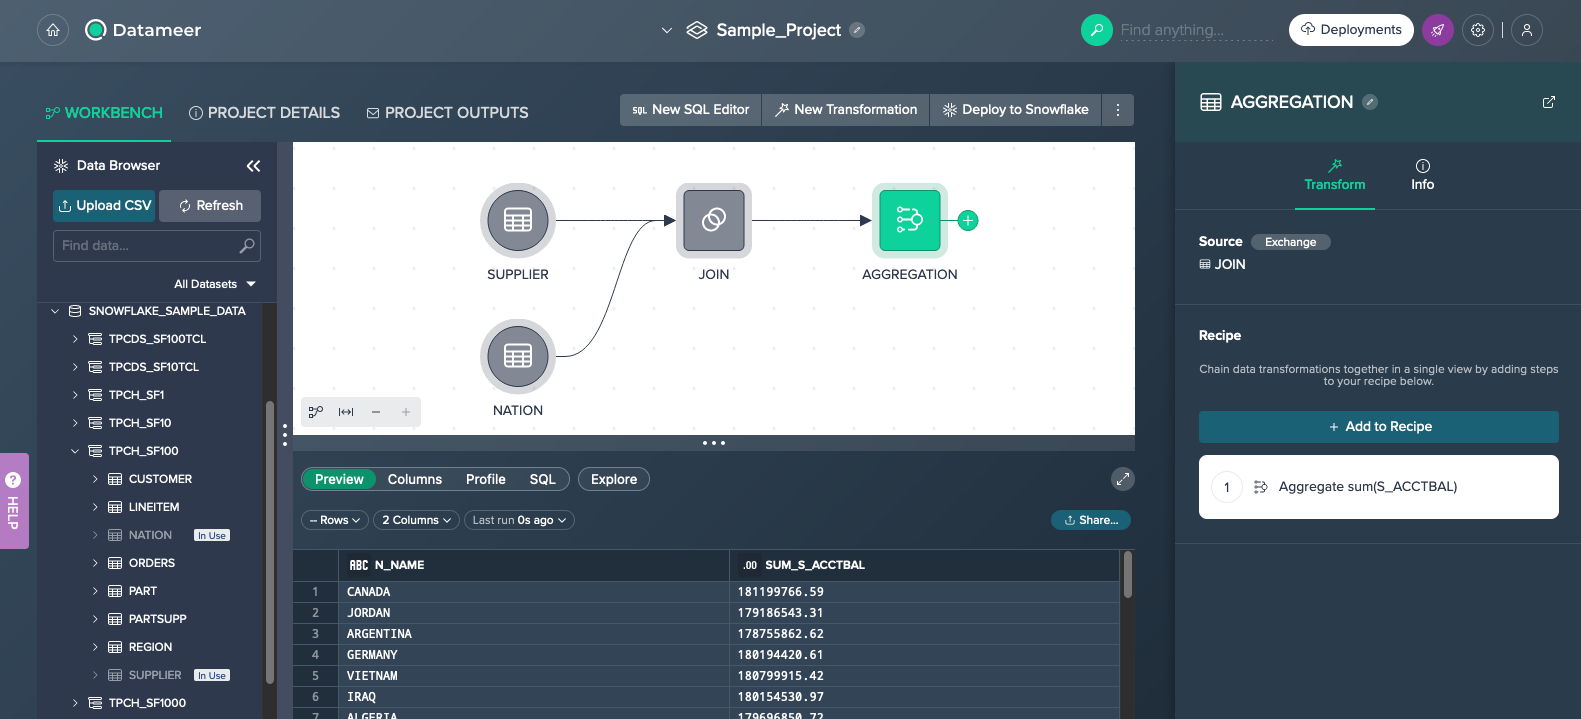
Performing the Aggregate Operation#
After joining the two sources we now want to perform another transformation. We want to aggregate the new Datameer view and group by the 'N_NAME' and afterwards use the account balance column 'S_ACCTBAL' as the measure.
We start from the new 'JOIN' view and click on the "+" and select "Aggregate". The 'Aggregate' dialog opens and on the left side we can see our columns.
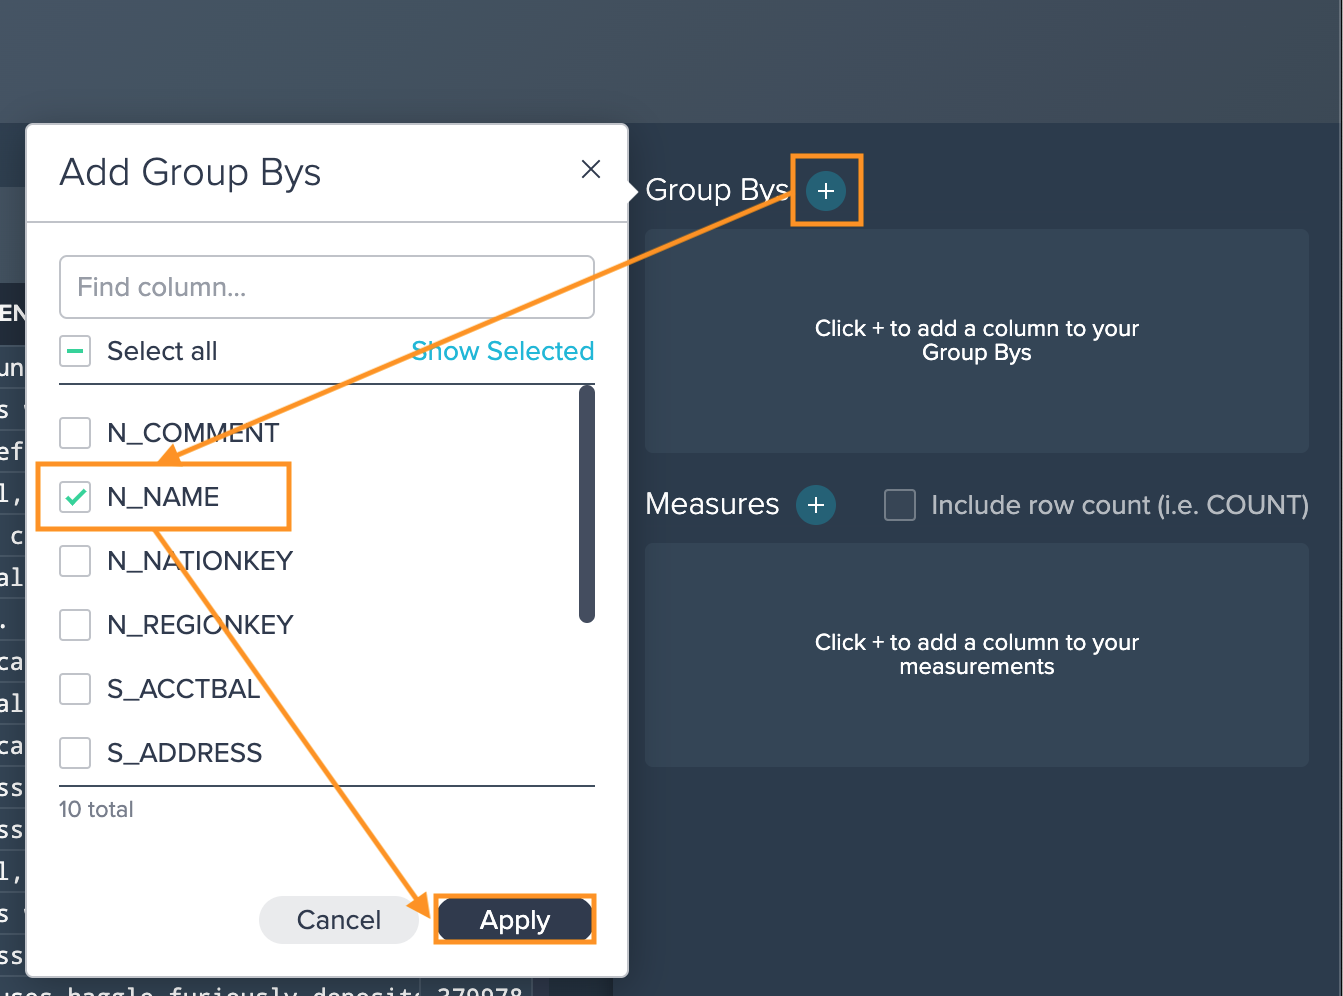
Next, we click on the "+" next to 'Group Bys' and select the column we want to sort after. In our example, we mark the 'N_NAME' entry and confirm with "Apply".
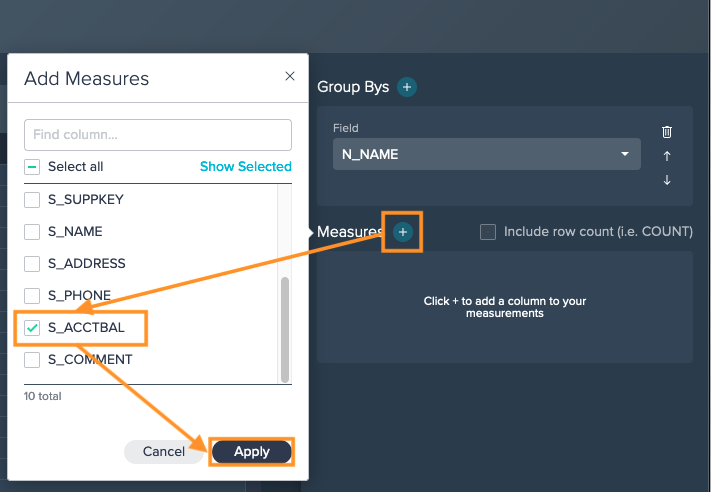
Then we click on "+" next to 'Measures', mark the 'S_ACCTBAL' and confirm with "Apply".
We can now finish the Aggregate operation and confirm with "Apply".
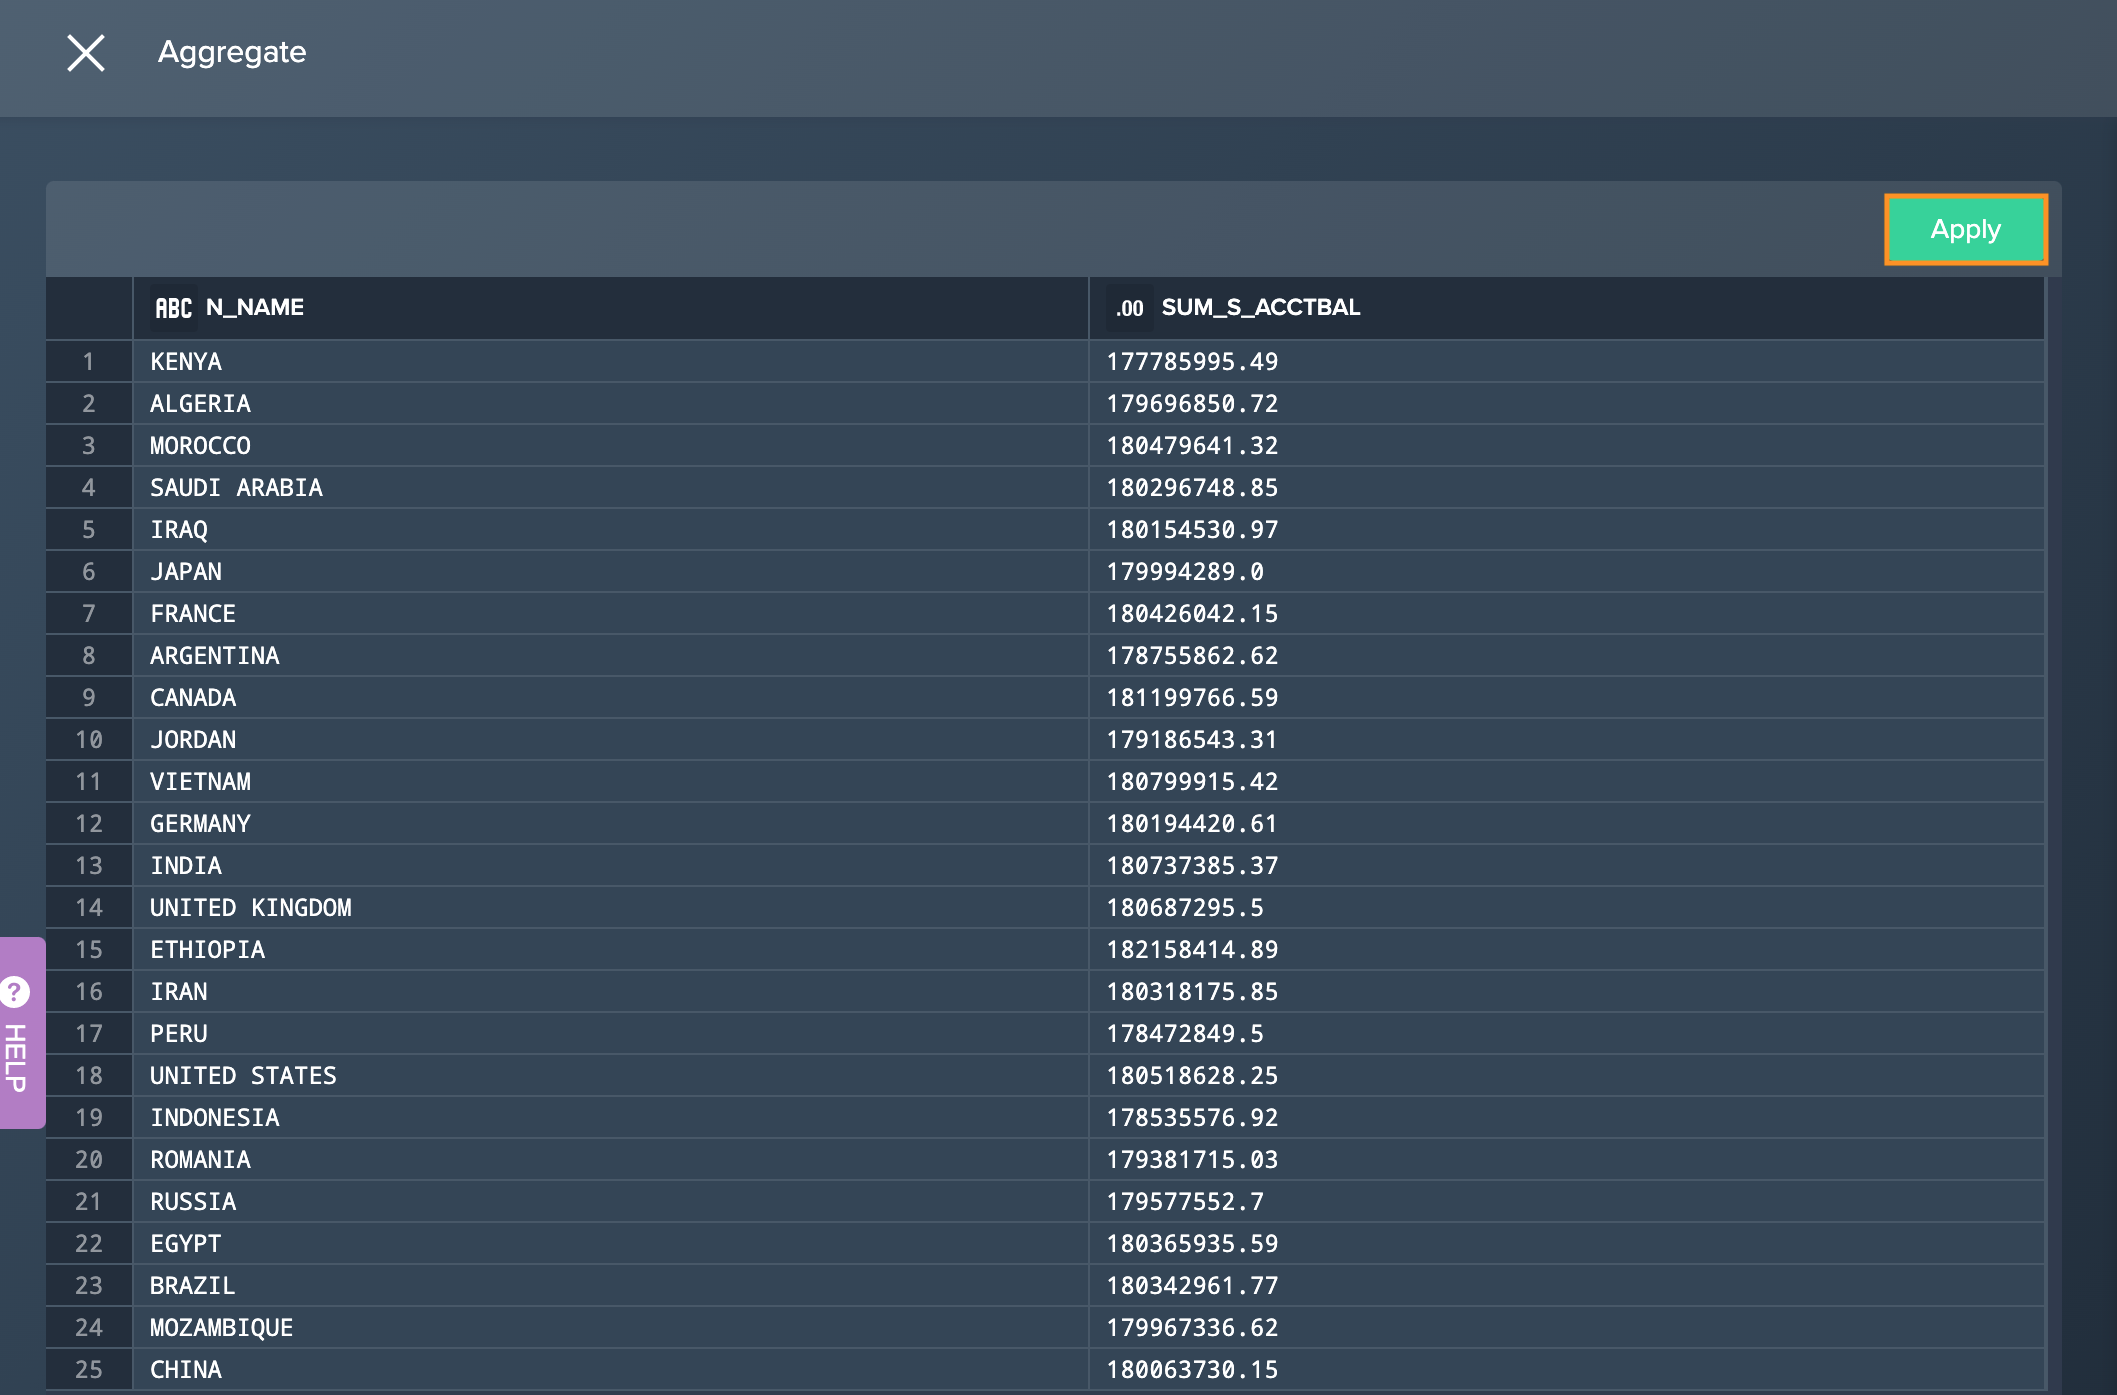
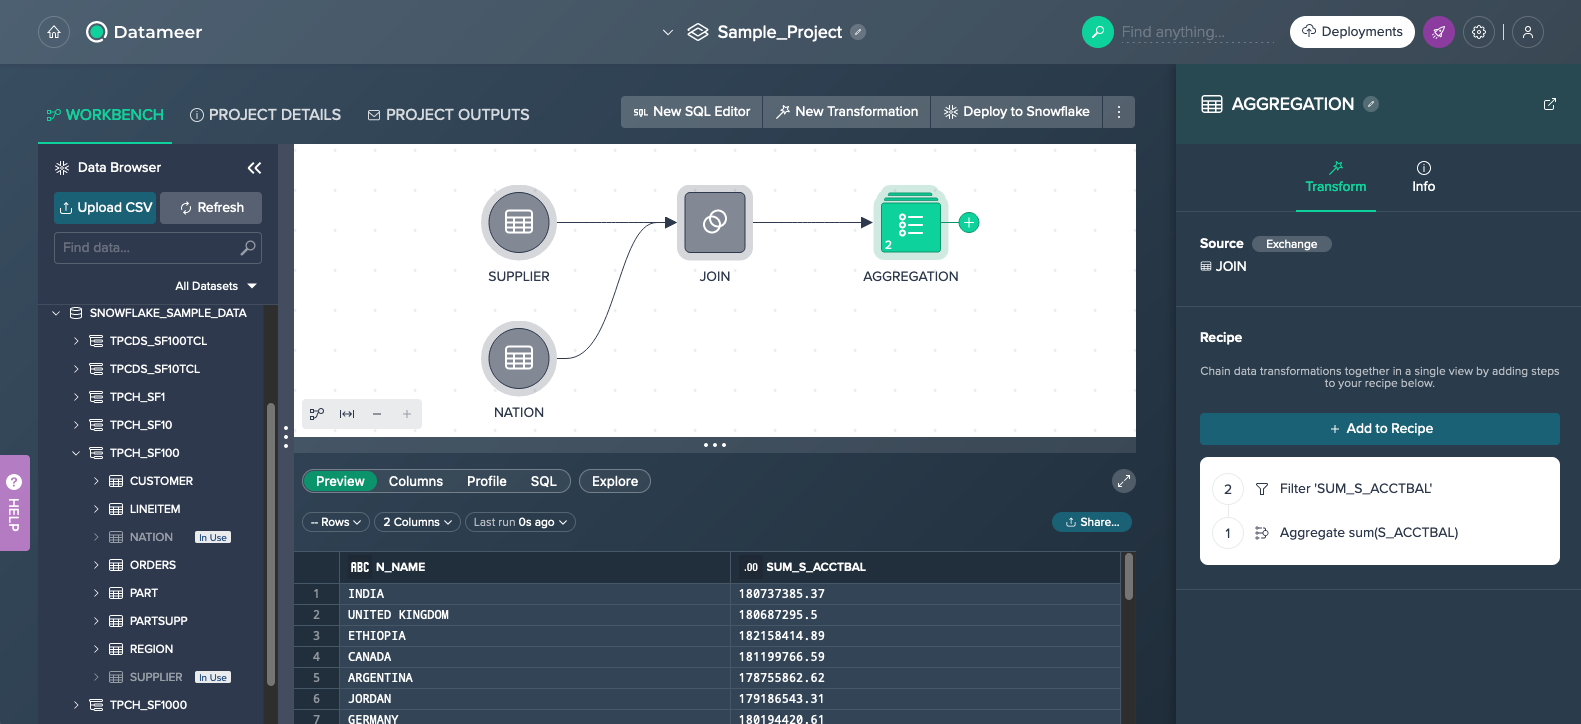
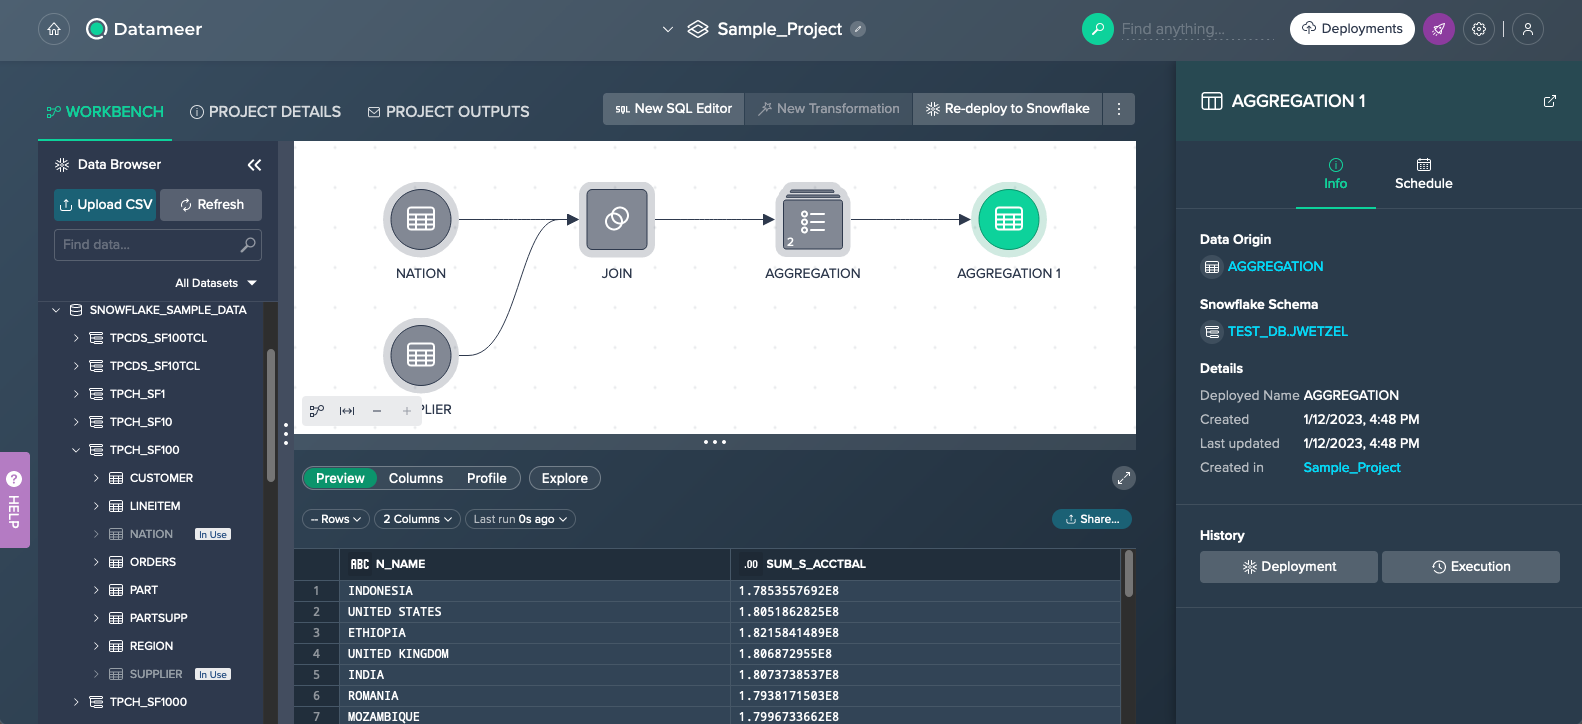
What we see as our Aggregate result is the following: In our Flow Area we have the two original Snowflake sources and the joined Datameer view we performed first. The new highlighted square that is named 'AGGREGATE' is the new aggregated Datameer view. We can later on rename the new view in the view's details, but for now we leave it as it is. The connected arrow line illustrates that this new Datameer view is based on the former Datameer view.
Adding a Filter to the Recipe#
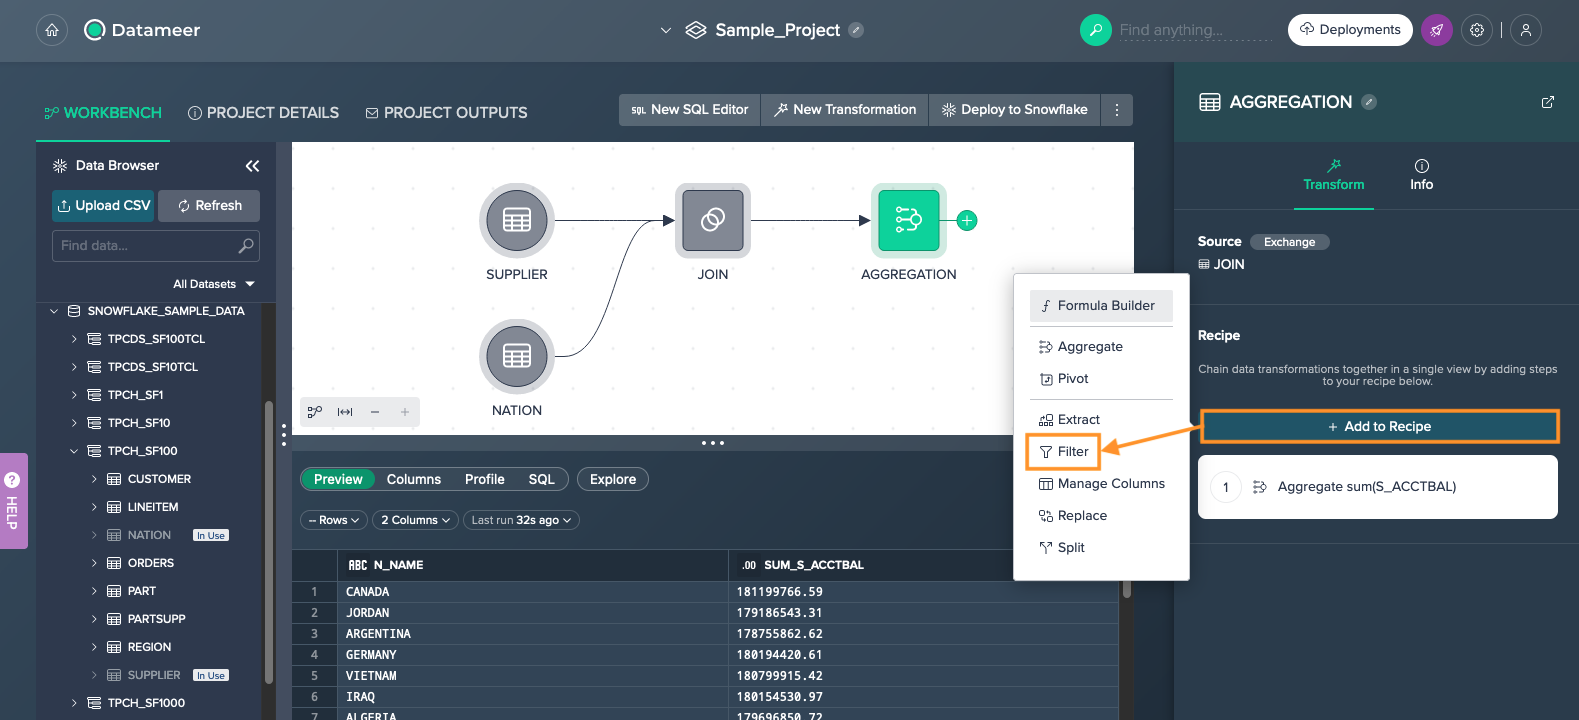
Some of the transformations can be chained together in the Recipe. We want to filter our 'AGGREGATION' dataset by a certain value now.
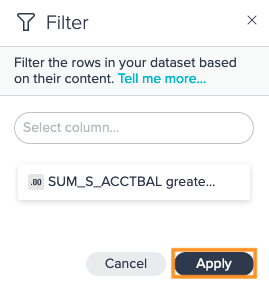
First, we click on "+ Add to Recipe" in the Inspector and then select "Filter".
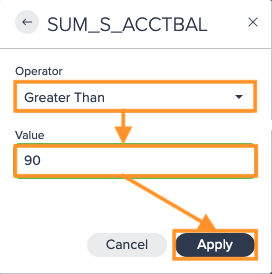
We enter or select the needed filter criteria in the dialog and confirm with "Apply".
Because we don't want to add another filter this time, we confirm with "Apply" again. The filter applies and the 'AGGREGATION' node appears with a small 2 which means that two operations have been applied. The 'Filter' operation is also added to the list in the Inspector and is editable or deletable later on.
Deploying the View/ Table to Snowflake#
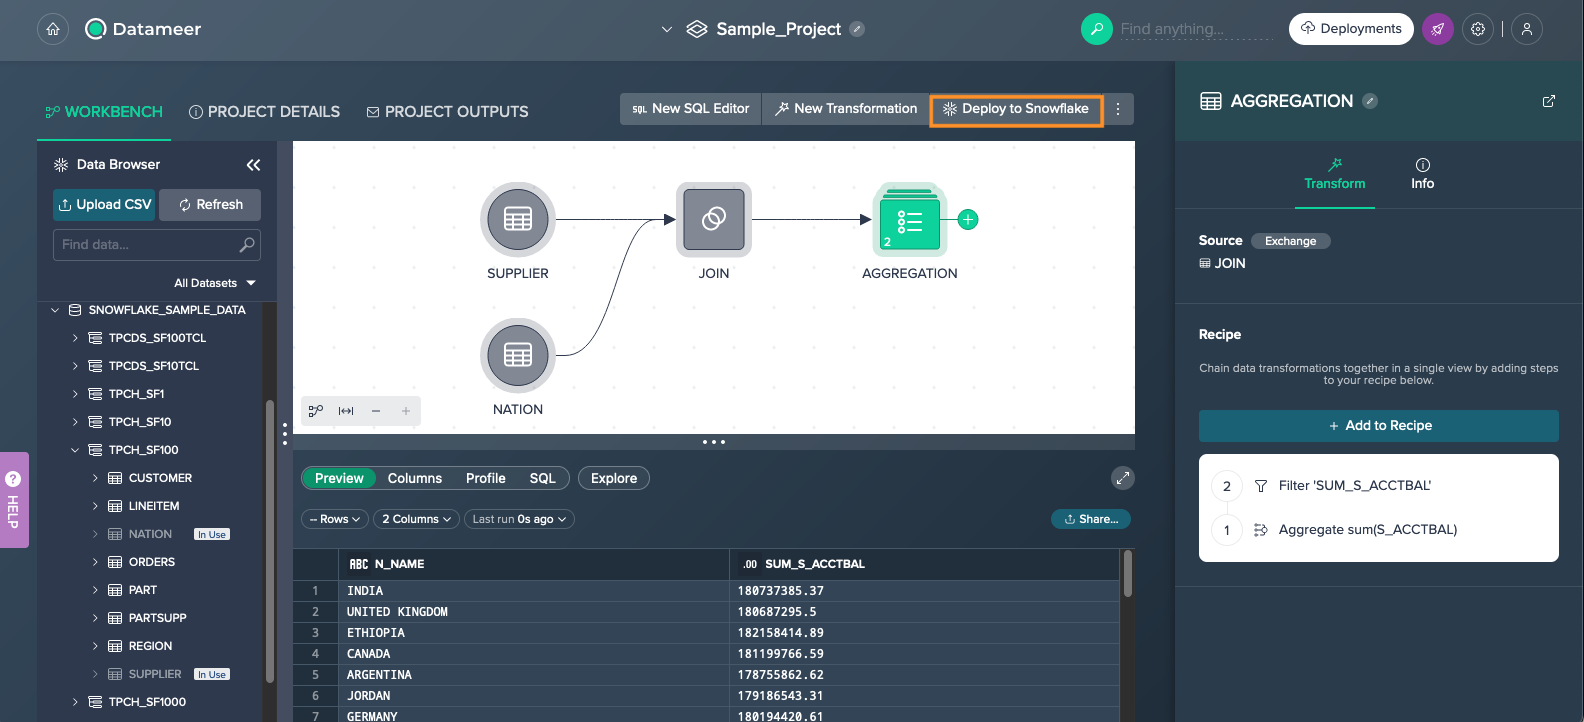
We are almost done. Finally we want to deploy our view/ table in Snowflake. Find more information about how to deploy here.
To do so, we click on "Deploy to Snowflake" on top of the Flow Area.
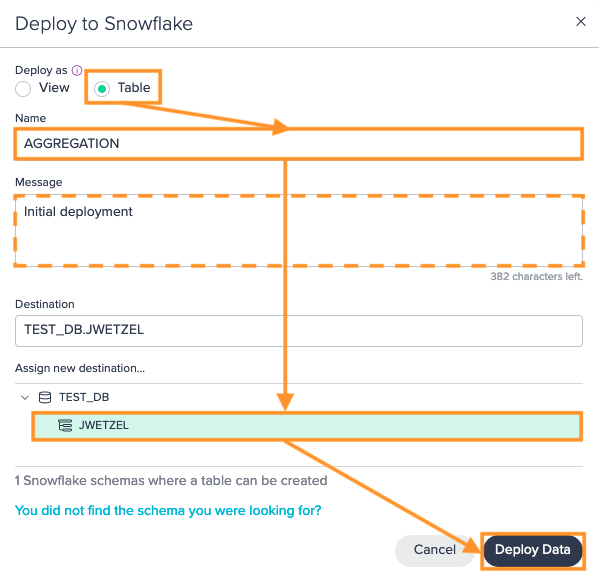
The 'Deploy to Snowflake dialog' opens and provides the deploying configuration. In general, deploying is possible as a view or as a table. For our sample use case, we select table. If needed, we can now rename our asset first, optionally enter a message, e.g. for change details, and then select the Snowflake destination by selecting the destination from the list below. Note that only the schemas for which you have privileges in snowflake are displayed.
Finally we confirm with "Deploy Data".
After a few moments, the deploying process is finished and we can see our deployed table in the Flow Area highlighted in green. The arrow line connects the table we created in Datameer with our deployed Snowflake view/ table.
Congratulations! We made it.