Working with Columns
Find here all information about working with columns in Spectrum.
INFO
Each Workbook can contain a maximum of 702 columns.
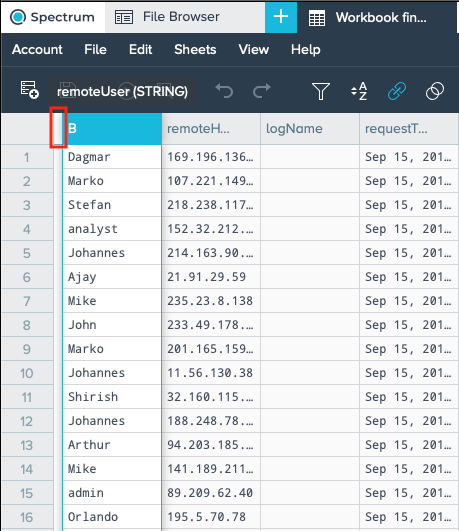
Renaming Columns#
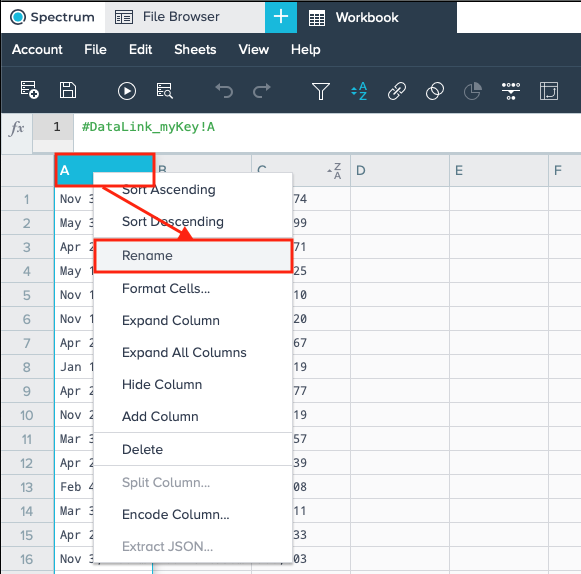
To rename a column:
-
Right-click a column name and select "Rename" or double-click a column name. The column name is marked as editable.
INFO: To cancel column renaming, press the 'Escape' key.
-
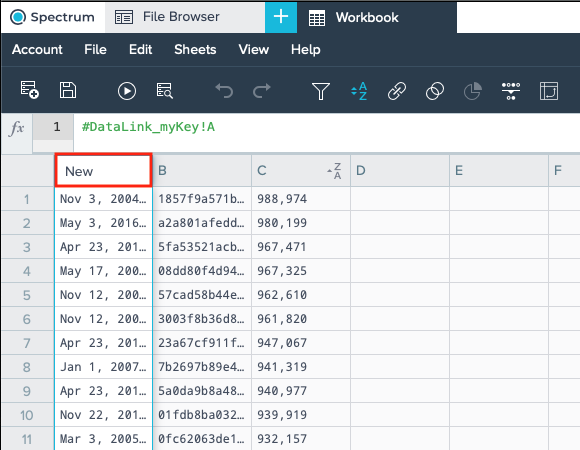
Enter the new column name.
INFO: Column names must only contain standard, capital order lower-case characters, numbers and/ or underscores. A column name cannot begin with a number.
INFO: Column names in all Workbook sheet types are case-sensitive, e.g. the column names 'Foo', 'fOO' etc. are unique columns within the same worksheet.
-
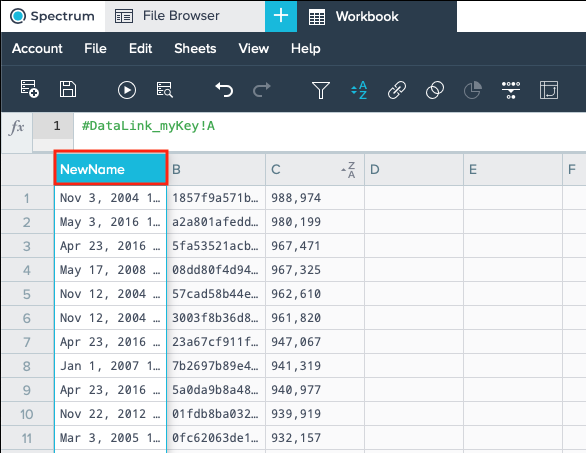
Confirm the entry with "Enter" key. Renaming is finished.
Adding Columns#
INFO
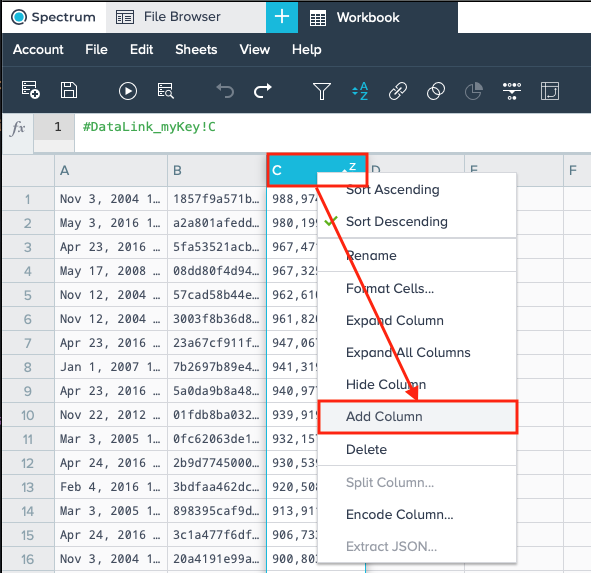
A column can only be added next to a column which has content. Added columns appear to the left of the outgoing column.
To add a column right-click a column name and select "Add Column". The new, empty column appears to the left. Adding a column is finished.
Reordering Columns#
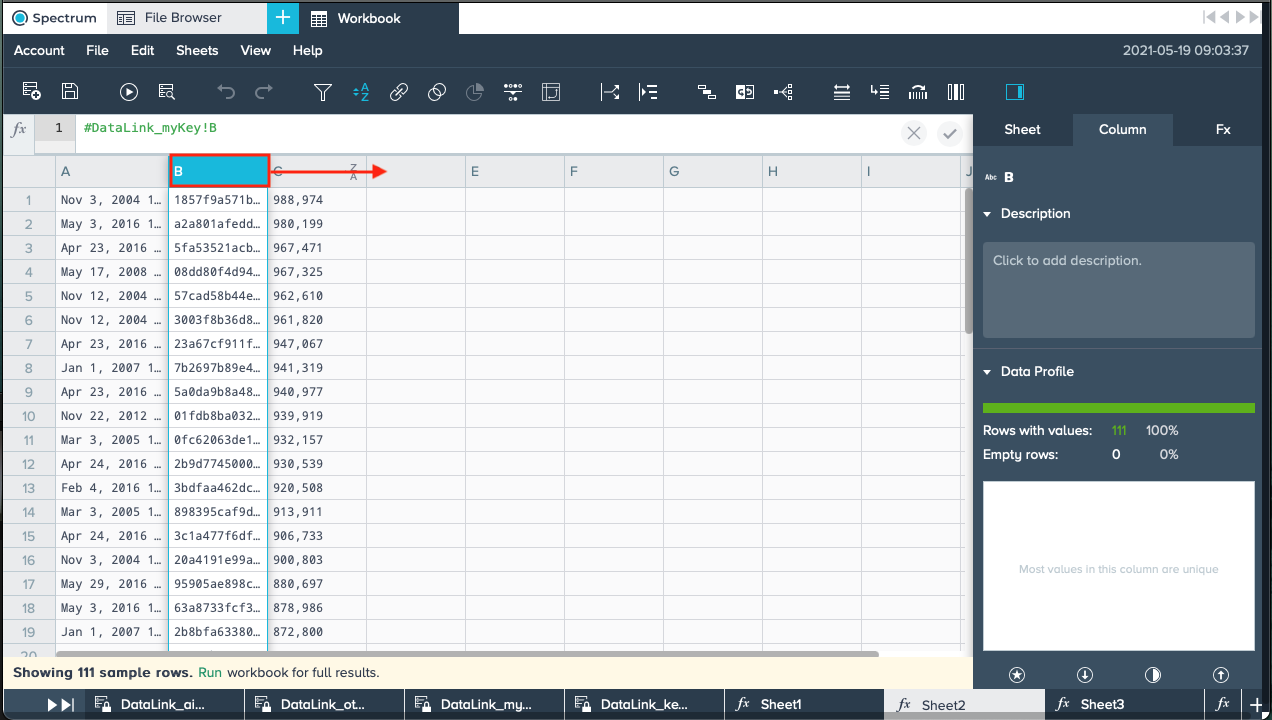
To remove a column left-click on a column header and drag and drop it at the required location.
INFO: A trailing mark shows the new location of the removed column by showing the column name during drag and drop.
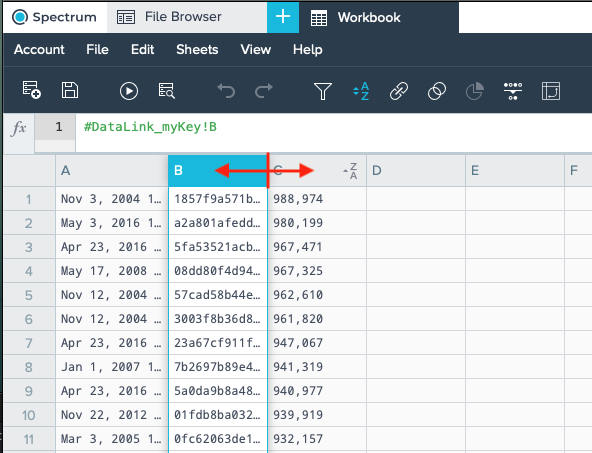
Resizing Columns#
To resize and adapt a column width, place the mouse between two column headings so the icon changes to a double-ended arrow and drag the column marker to the desired width.
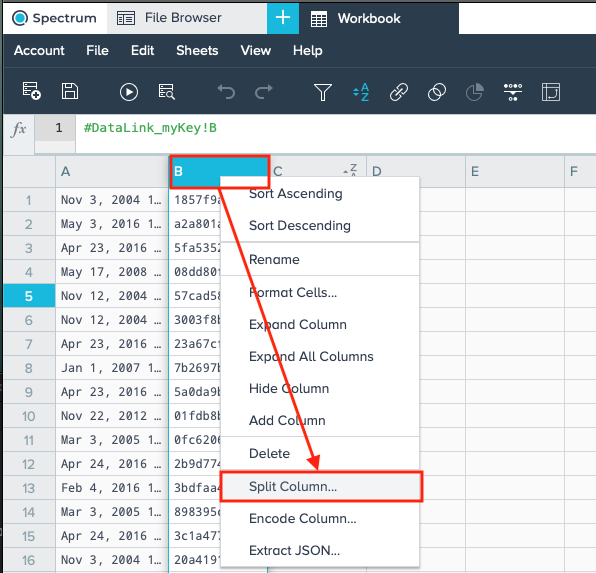
Splitting Columns#
INFO
The split column operation can be updated as many times as you like until you have desired split configuration.
To split a Column:
-
Right-click on a column header and select "Split Column" or click on the "Split Column" icon in the toolbar. The dialog 'Split to columns' opens in the Workbook Inspector.
or

-
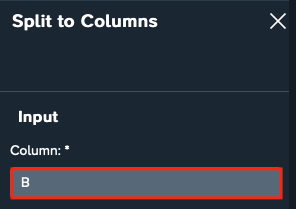
Select the required column.
INFO: The column name from where the right-click was executed is set per default in the field. You can change the column if needed.
-
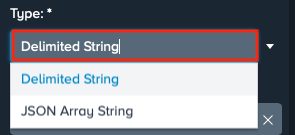
Select the split type from the drop-down.
-
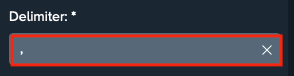
Enter the delimiter.
INFO: A comma is set as delimiter per default.
-
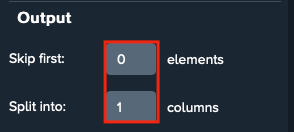
Decide if leading or trailing characters shall be skipped.

-
Decide if elements shall be skipped and in how many columns the column shall be divided.
-
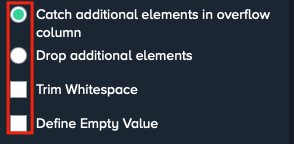
Decide if additional elements shall be either caught in an overflow column or be dropped. Decide also if to Trim Whitespace and how to define empty values by marking the respective checkbox.
-
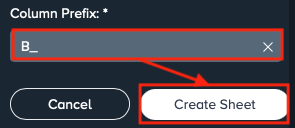
Enter the column prefix for the split column and confirm with "Create Sheet". The split column is displayed in a new sheet.
INFO: The new column name begins with 'Name _' per default.
Encoding Columns#
Column encoding performs ordinal, one-hot or binned encoding on column data which assigns a unique numeric value to each categorical or continuous value. Once applied, column encoding can be updated as needed until the desired results are achieved.
Column encoding provides a consistent view of prepared data which is especially helpful for teams working together on model building and testing activities.
INFO
Columns with a high cardinality are not suited for ordinal/ binned encoding.
Ordinal Encoding#
For ordinal encoding:
-
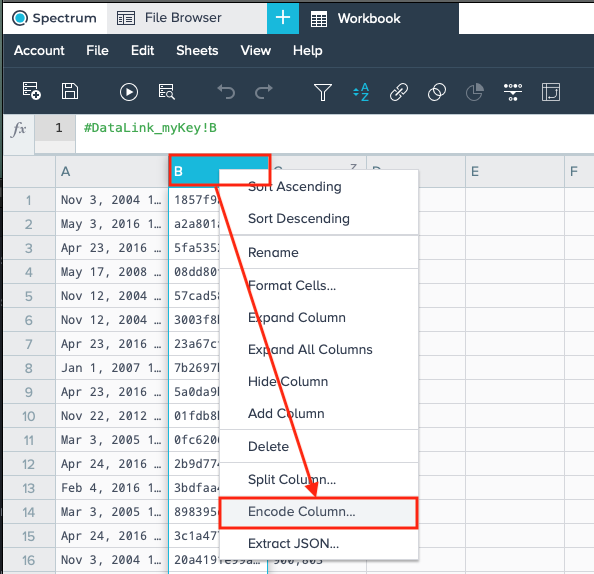
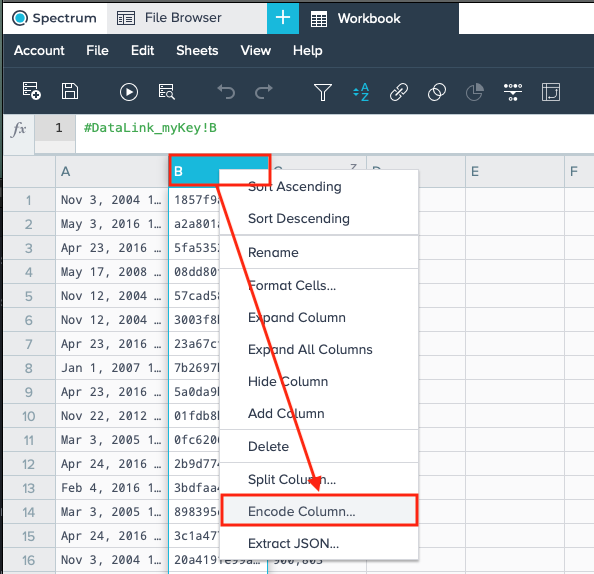
Right-click on a column header and select "Encoding" or click on the "Encode Column" icon from the toolbar. The 'Encode Column' dialog is displayed on the right.
or

-
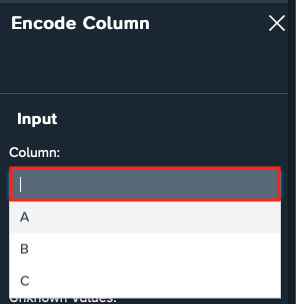
If needed, change the column by entering the required column name in 'Column'.
-
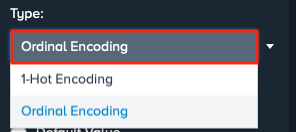
Select the encoding type "Ordinal Encoding" from the drop-down. Further selection options adapt to the needs.
-
Decide how to deal with unknown values by clicking the required statement.
INFO: 'Drop Value' ignores values beyond the first 100 most frequent. 'Default Value' shows values, which can not be encoded.

-
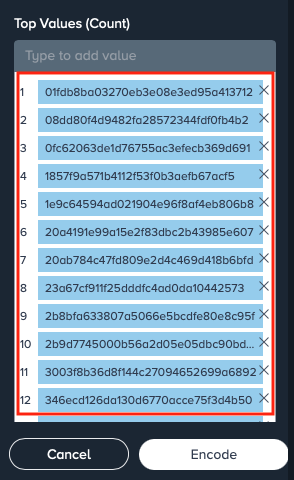
View the top 32 values (by count).
-
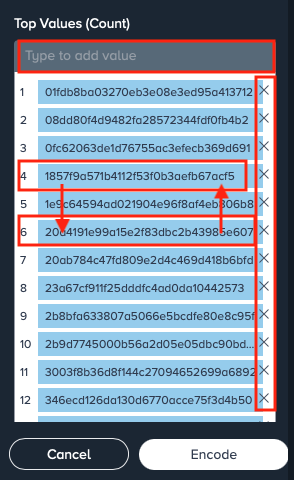
If needed, add a new value in the blank field, change the order of the top values or delete single values.
-
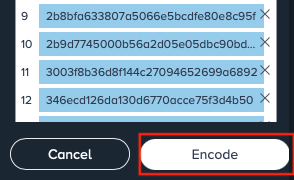
Confirm with "Encode". The encoding result is displayed in a new encoding sheet within the Workbook. Ordinal Encoding is finished.
One-hot Encoding#
For one-hot encoding:
-
Right-click on a column header and select "Encoding" or click on the "Encode Column" icon from the toolbar. The 'Encode Column' dialog is displayed on the right.
*or

-
If needed, change the column by entering the required column name in 'Column'.

-
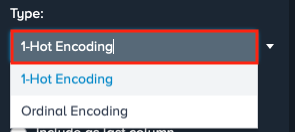
Select the encoding type "1-Hot Encoding" from the drop-down. Further selection options adapt to the needs.
-
Decide how to deal with unknown values by clicking the required statement.
INFO: 'Drop Value' ignores values beyond the first 100 most frequent. 'Include at last column' adds a new element to the list that encodes together all values beyond the 100 most frequent.

-
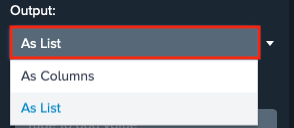
Select the output format from the dropdown 'Output'.
INFO: 'As List' keeps all binary pairs together in a single column. 'As Column' creates binary pairs each in their own column.
-
View the top 32 values (by count).

-
If needed, add a new value in the blank field, change the order of the top values or delete single values.

-
Confirm with "Encode". The encoding result is displayed in a new encoding sheet within the Workbook. One-hot encoding is finished.

Binned Encoding#
For binned encoding:
-
Right-click on a column header and select "Encoding" or click on the "Encode Column" icon from the toolbar. The 'Encode Column' dialog is displayed on the right.

or

-
If needed, change the column by entering the required column name in 'Column'.

-
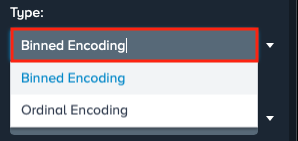
Select the encoding type "Binned Encoding" from the drop-down. Further selection options adapt to the needs.
-
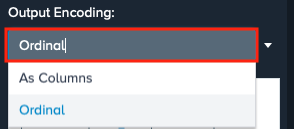
Select the output format from the dropdown 'Output'.
INFO: 'As List' keeps all binary pairs together in a single column. 'Ordinal' encodes as ordinal numbers in a single column.
-
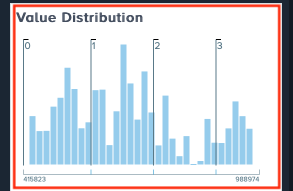
View the default value distributions.
INFO: The graph changes according to the amount of dividers.
-
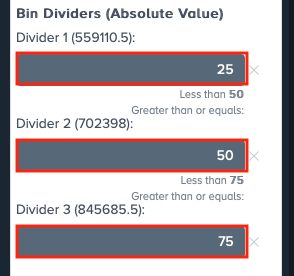
Enter the required bin dividers to change the percentile size of the divider.
INFO: There are 3 dividers set as default, e.g. 'Divider 1' contains the 25% of the selected column values.
INFO: To delete a divider, click on "x" next to the required divider.
-
If needed, click on "Add new Divider" to add a new divider.
INFO: Clinking the button adds an additional bucket, recalculates the percentile size and the corresponding absolute values.

-
Confirm with "Encode". The encoding result is displayed in a new encoding sheet within the Workbook. Binned encoding is finished.

Hiding Columns#
TIP
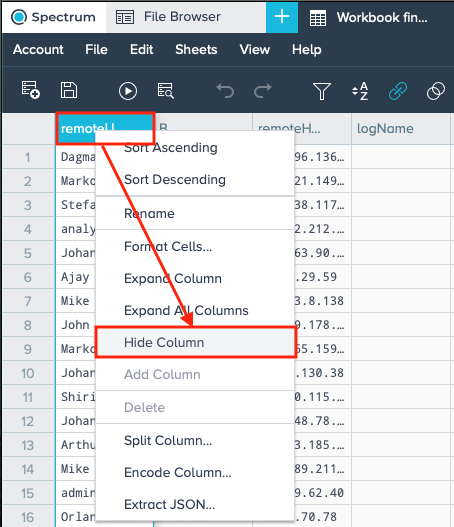
To hide a larger number of columns at the same time, use the 'Toggle Columns' option.
To hide a column, right-click on a column header and select "Hide Column". The whole column hides.
Expanding Columns#
To expand a hidden column, double-click in the small area where the column was before. The whole column appears.
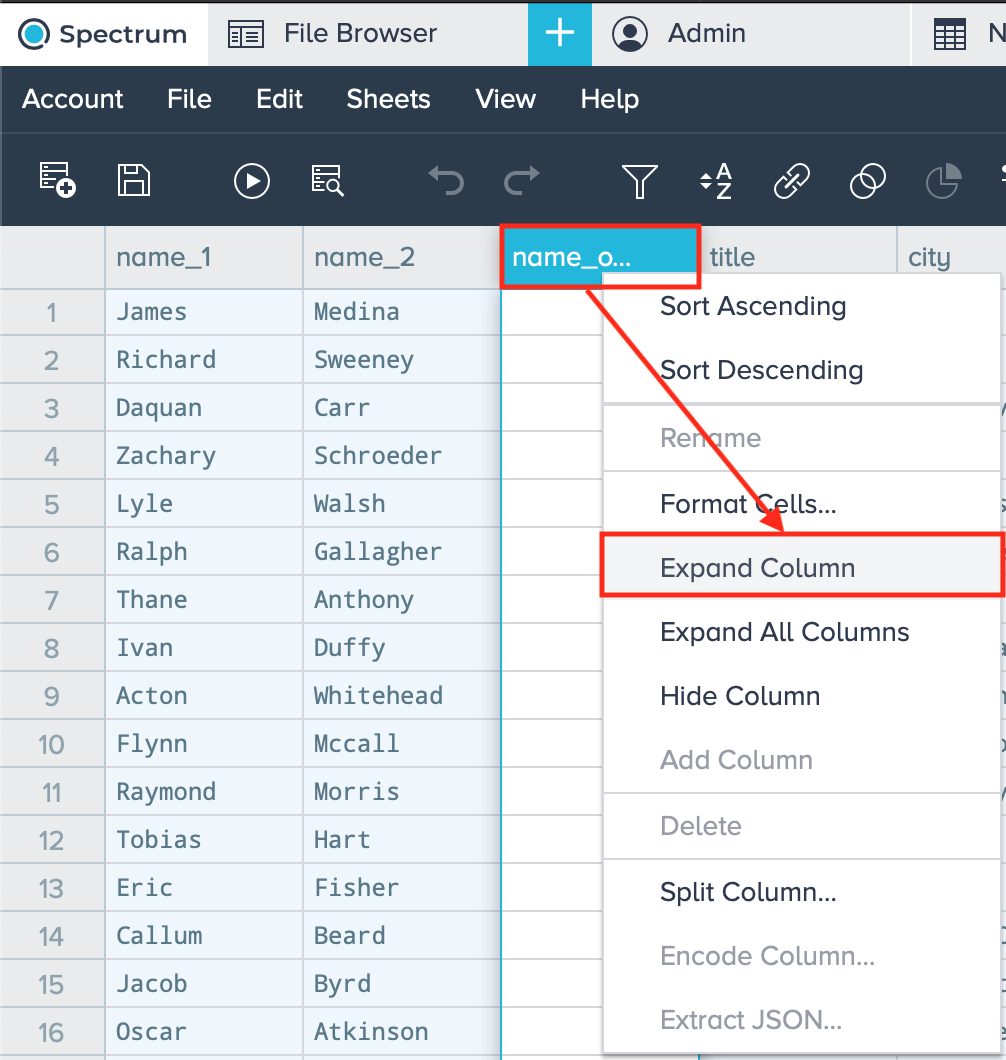
To expand a long column header, right-click in the column header and select "Expand Column". Only the column header is displayed fully.
INFO: When having a longer cell content than the width of the column header is, the cell content is displayed only within the width of the column header. Further cell content is hidden.
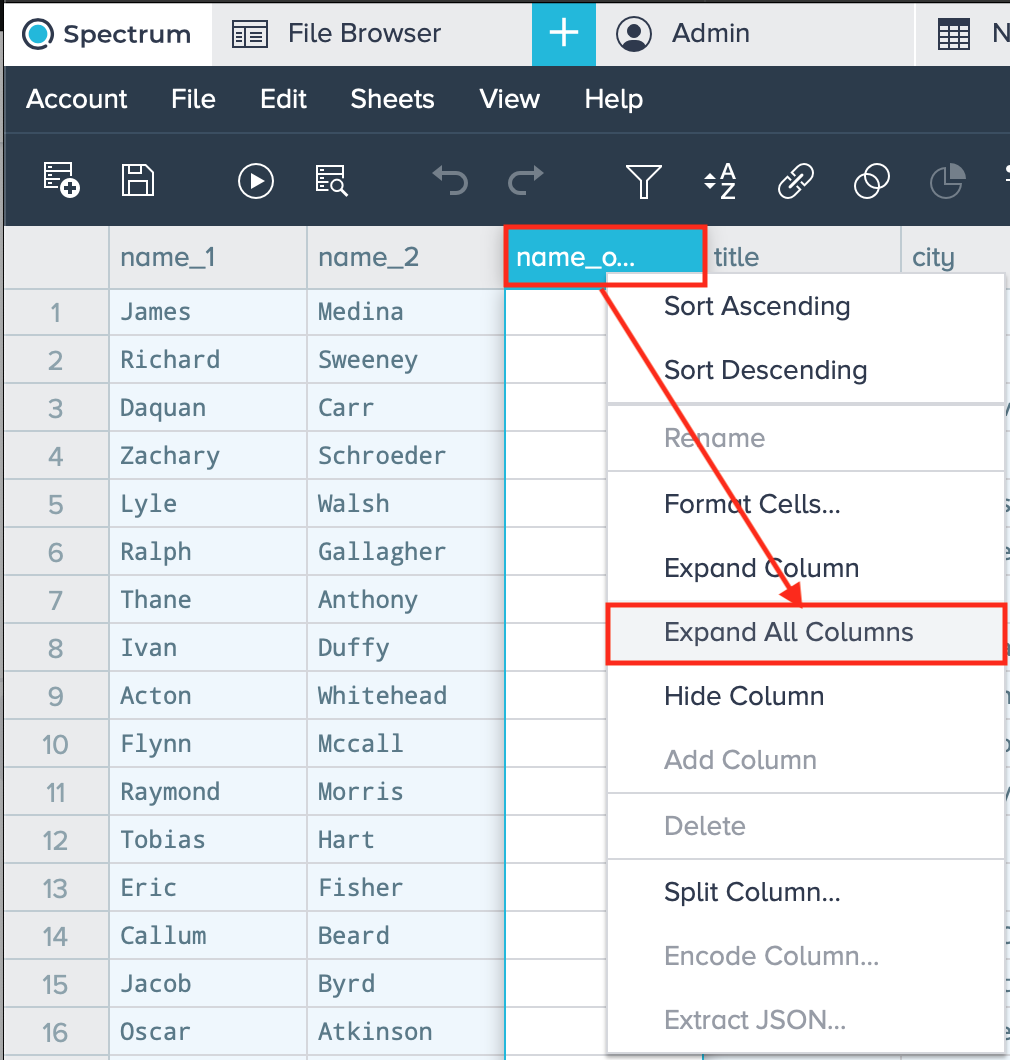
To expand all column headers, right-click in the column header and select "Expand All Columns". Only the column headers are displayed fully.
INFO: When having longer cell content than the width of the column header is, the cell content is displayed only within the width of the column headers. Further cell content is hidden.
JSON Parsing From a Column#
INFO
You can parse columns with JSON format within a JSON sheet.
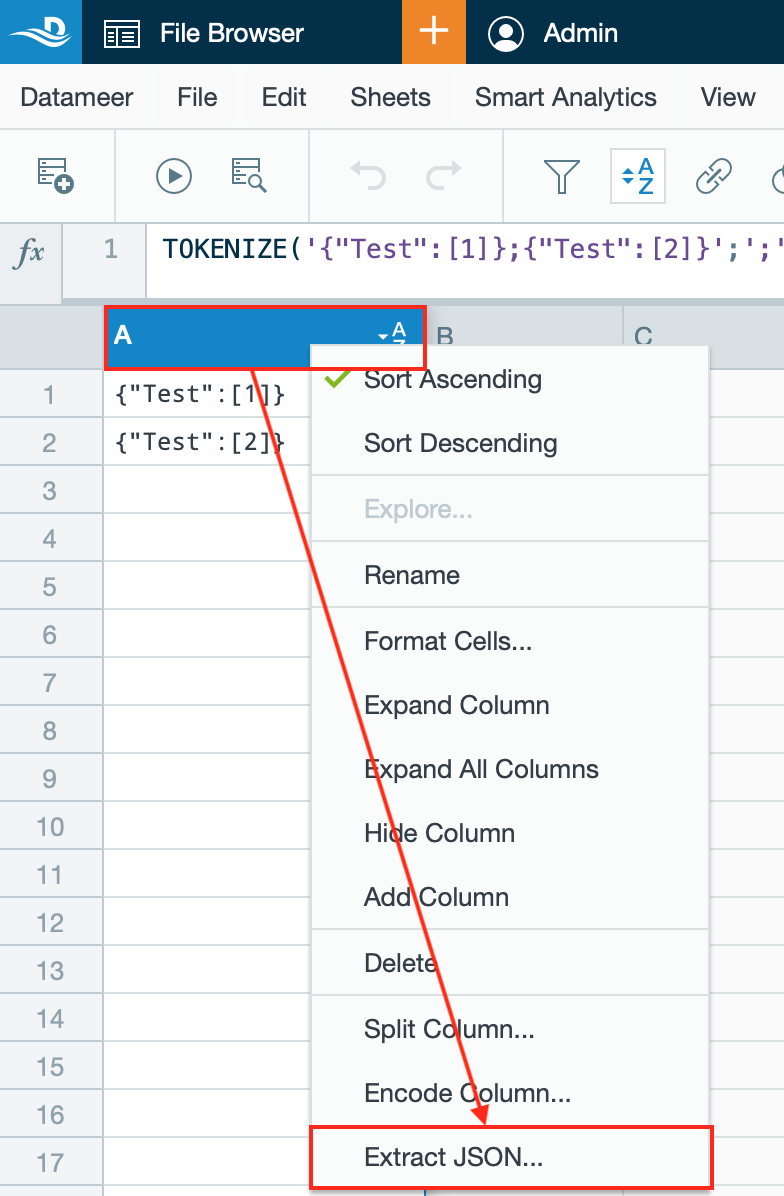
Accessing JSON#
To extract JSON, right-click on a string column value or right-click and select "Extract JSON"/ "Extract values from JSON". The dialog 'JSON Parsing' with the active tab 'X-Ray View' opens.
or
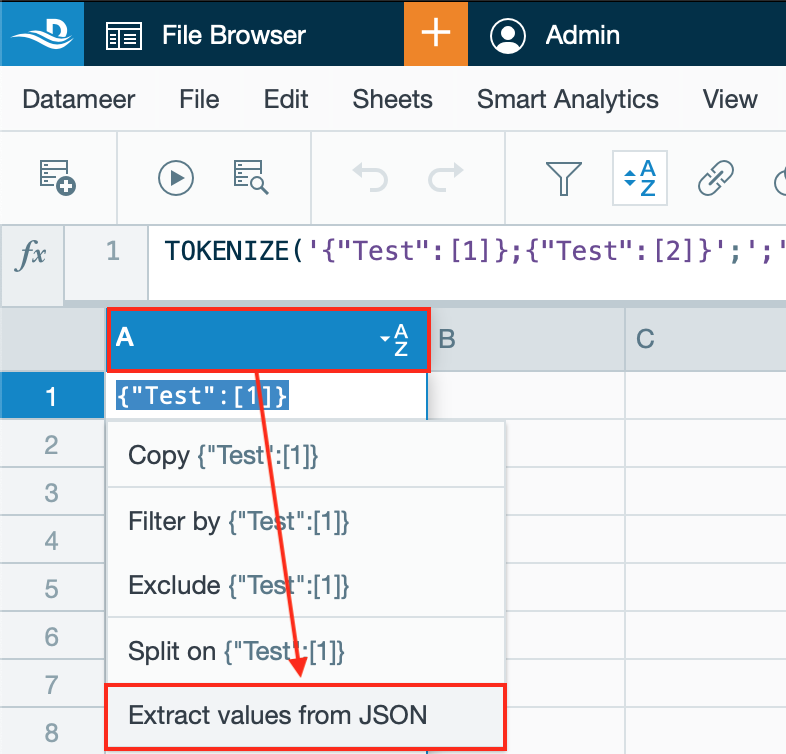
Configuring the JSON Extraction#
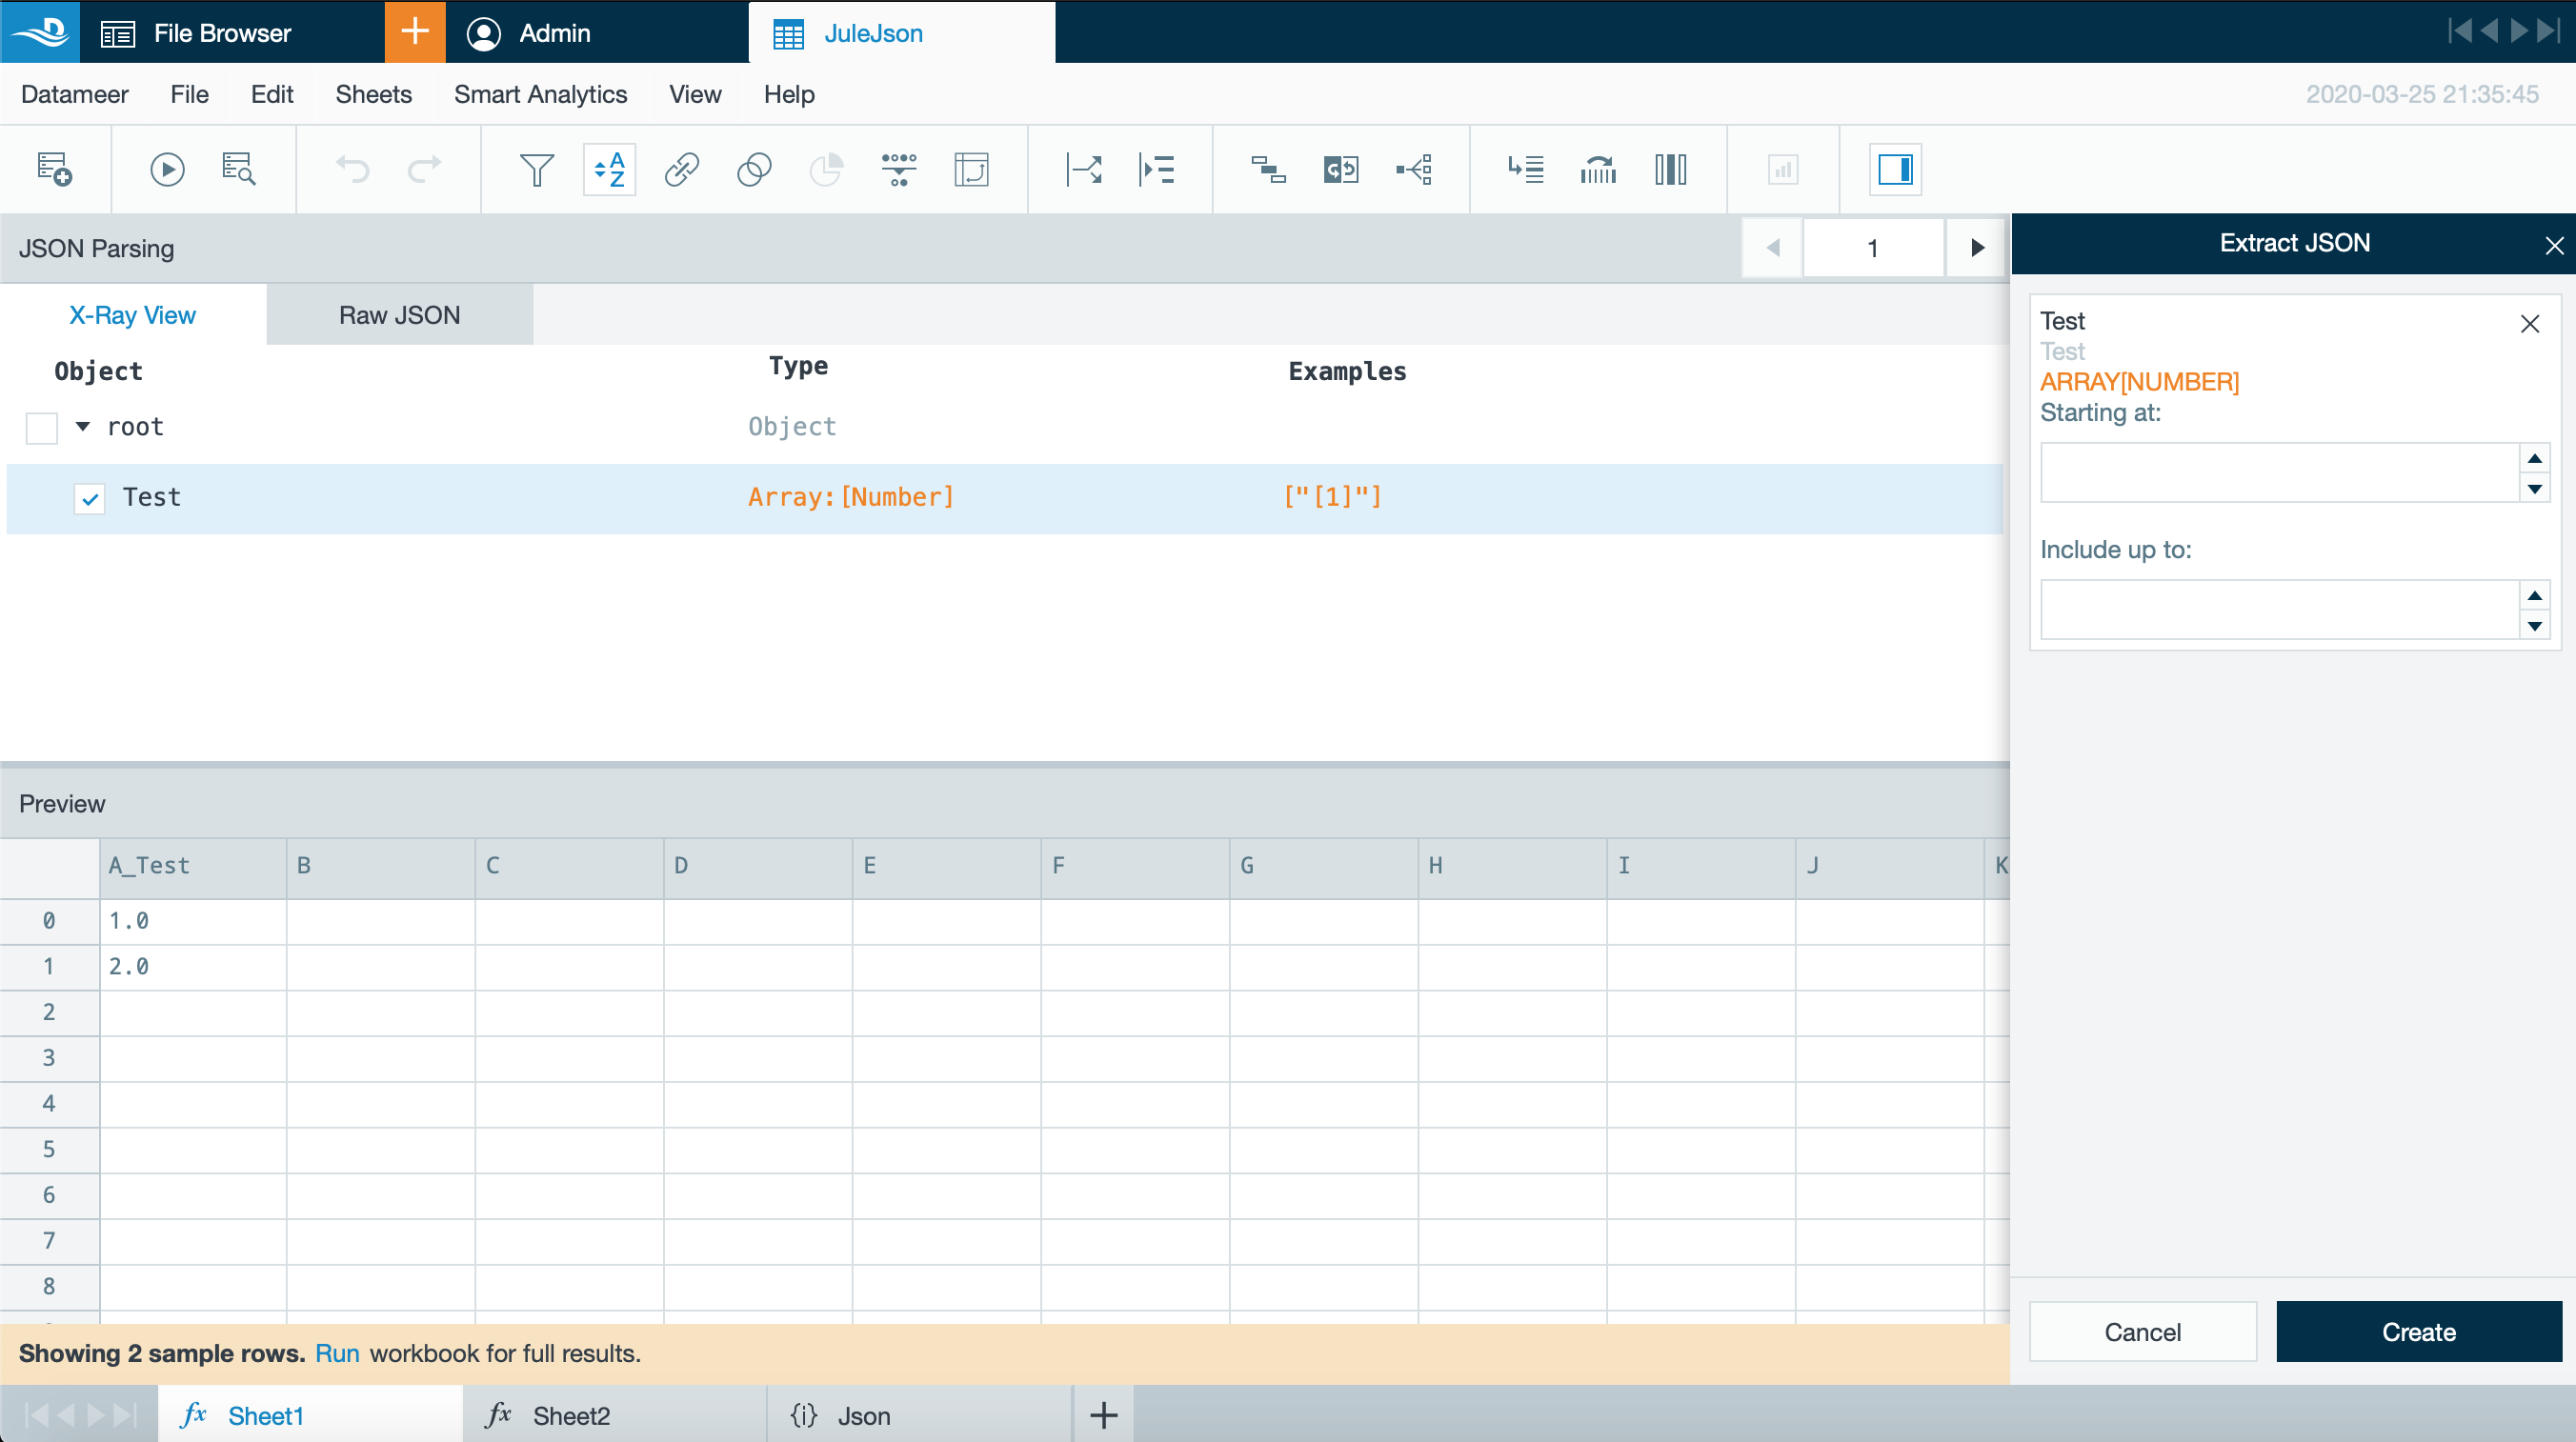
INFO
You can see the single node within the root structure, showing the object type and an example.
Each node will create a card on the right-hand side. Depending on the type of node, additional configuration options will become available.
Each selected node will be added with path specificity. To select multiple nodes with the same name, select each of them.
Find a preview of your JSON extraction in the 'Preview' section.
INFO
To switch between the records and check the generated JSON schema, click on the pagination arrays or enter a valid record number.
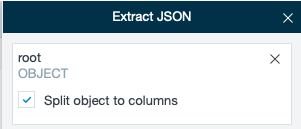
-
having the root object activated by clicking the check box, gives you the option to split the objects to columns
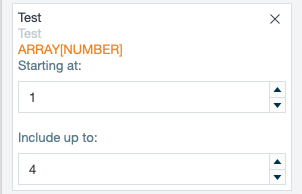
-
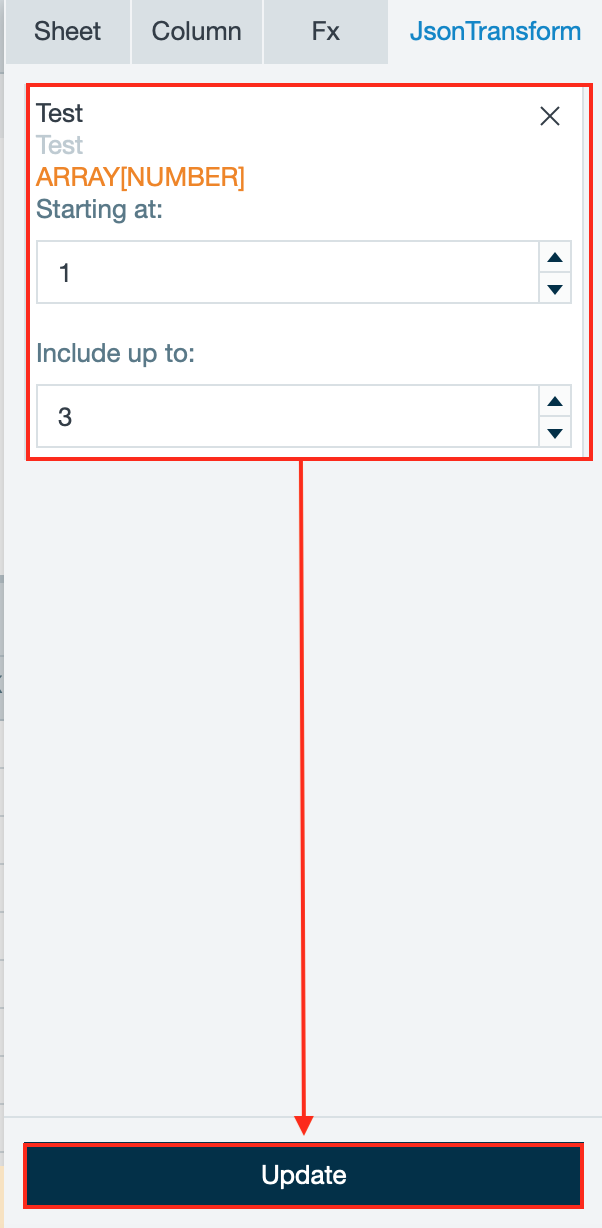
specifying the start and end index values in the 'Extract JSON' tab within the Workbook Inspector is possible
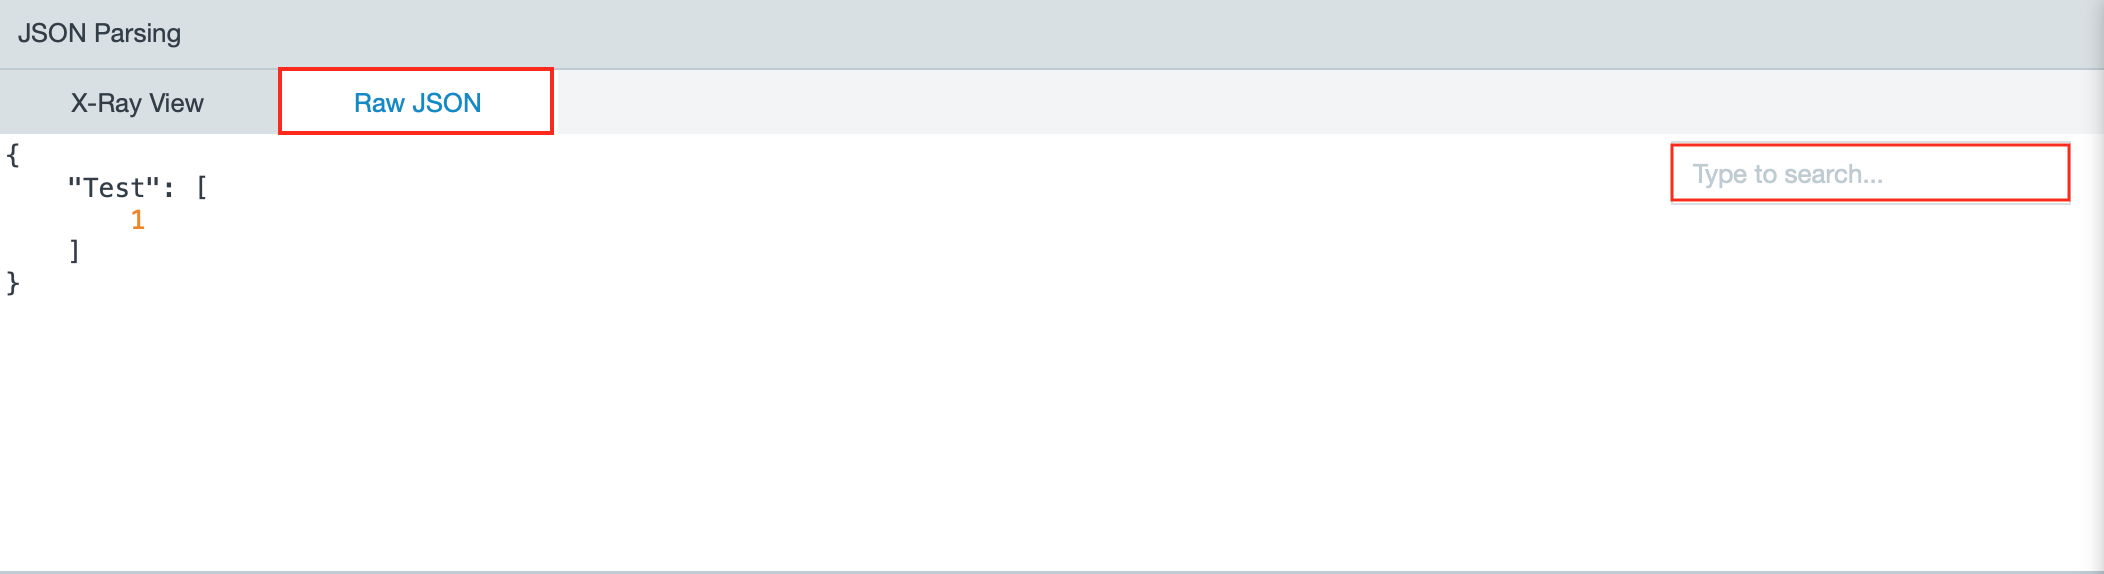
Viewing Raw JSON & Searching for a Node#
To view the raw JSON view, click on the tab "Raw JSON".
INFO: You can search for a node in the search bar on the right side.
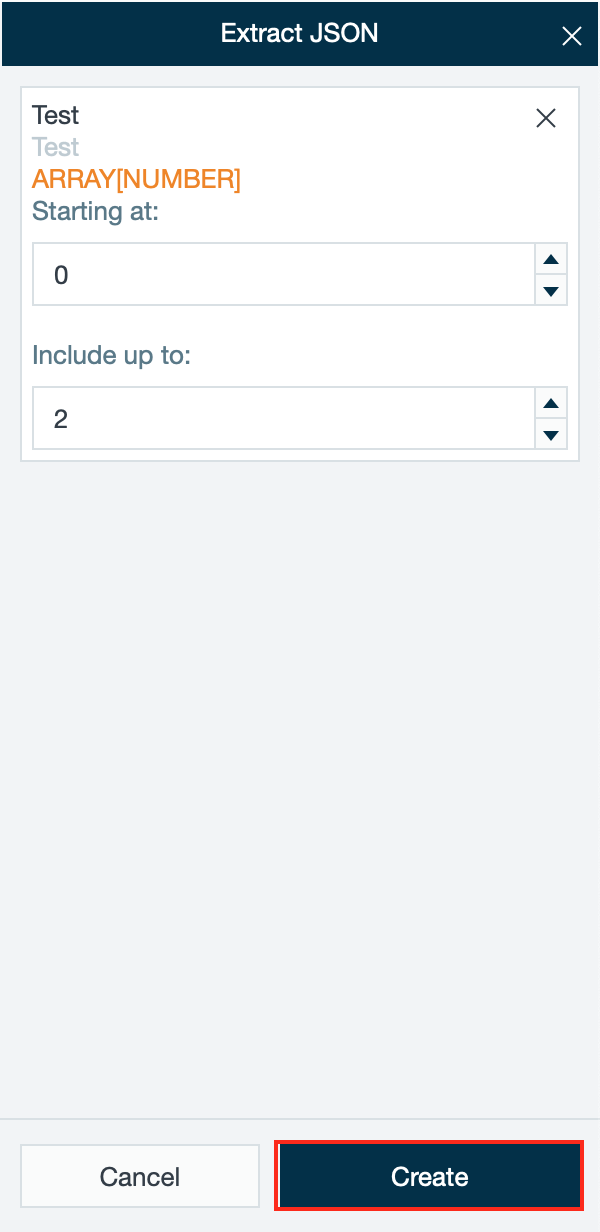
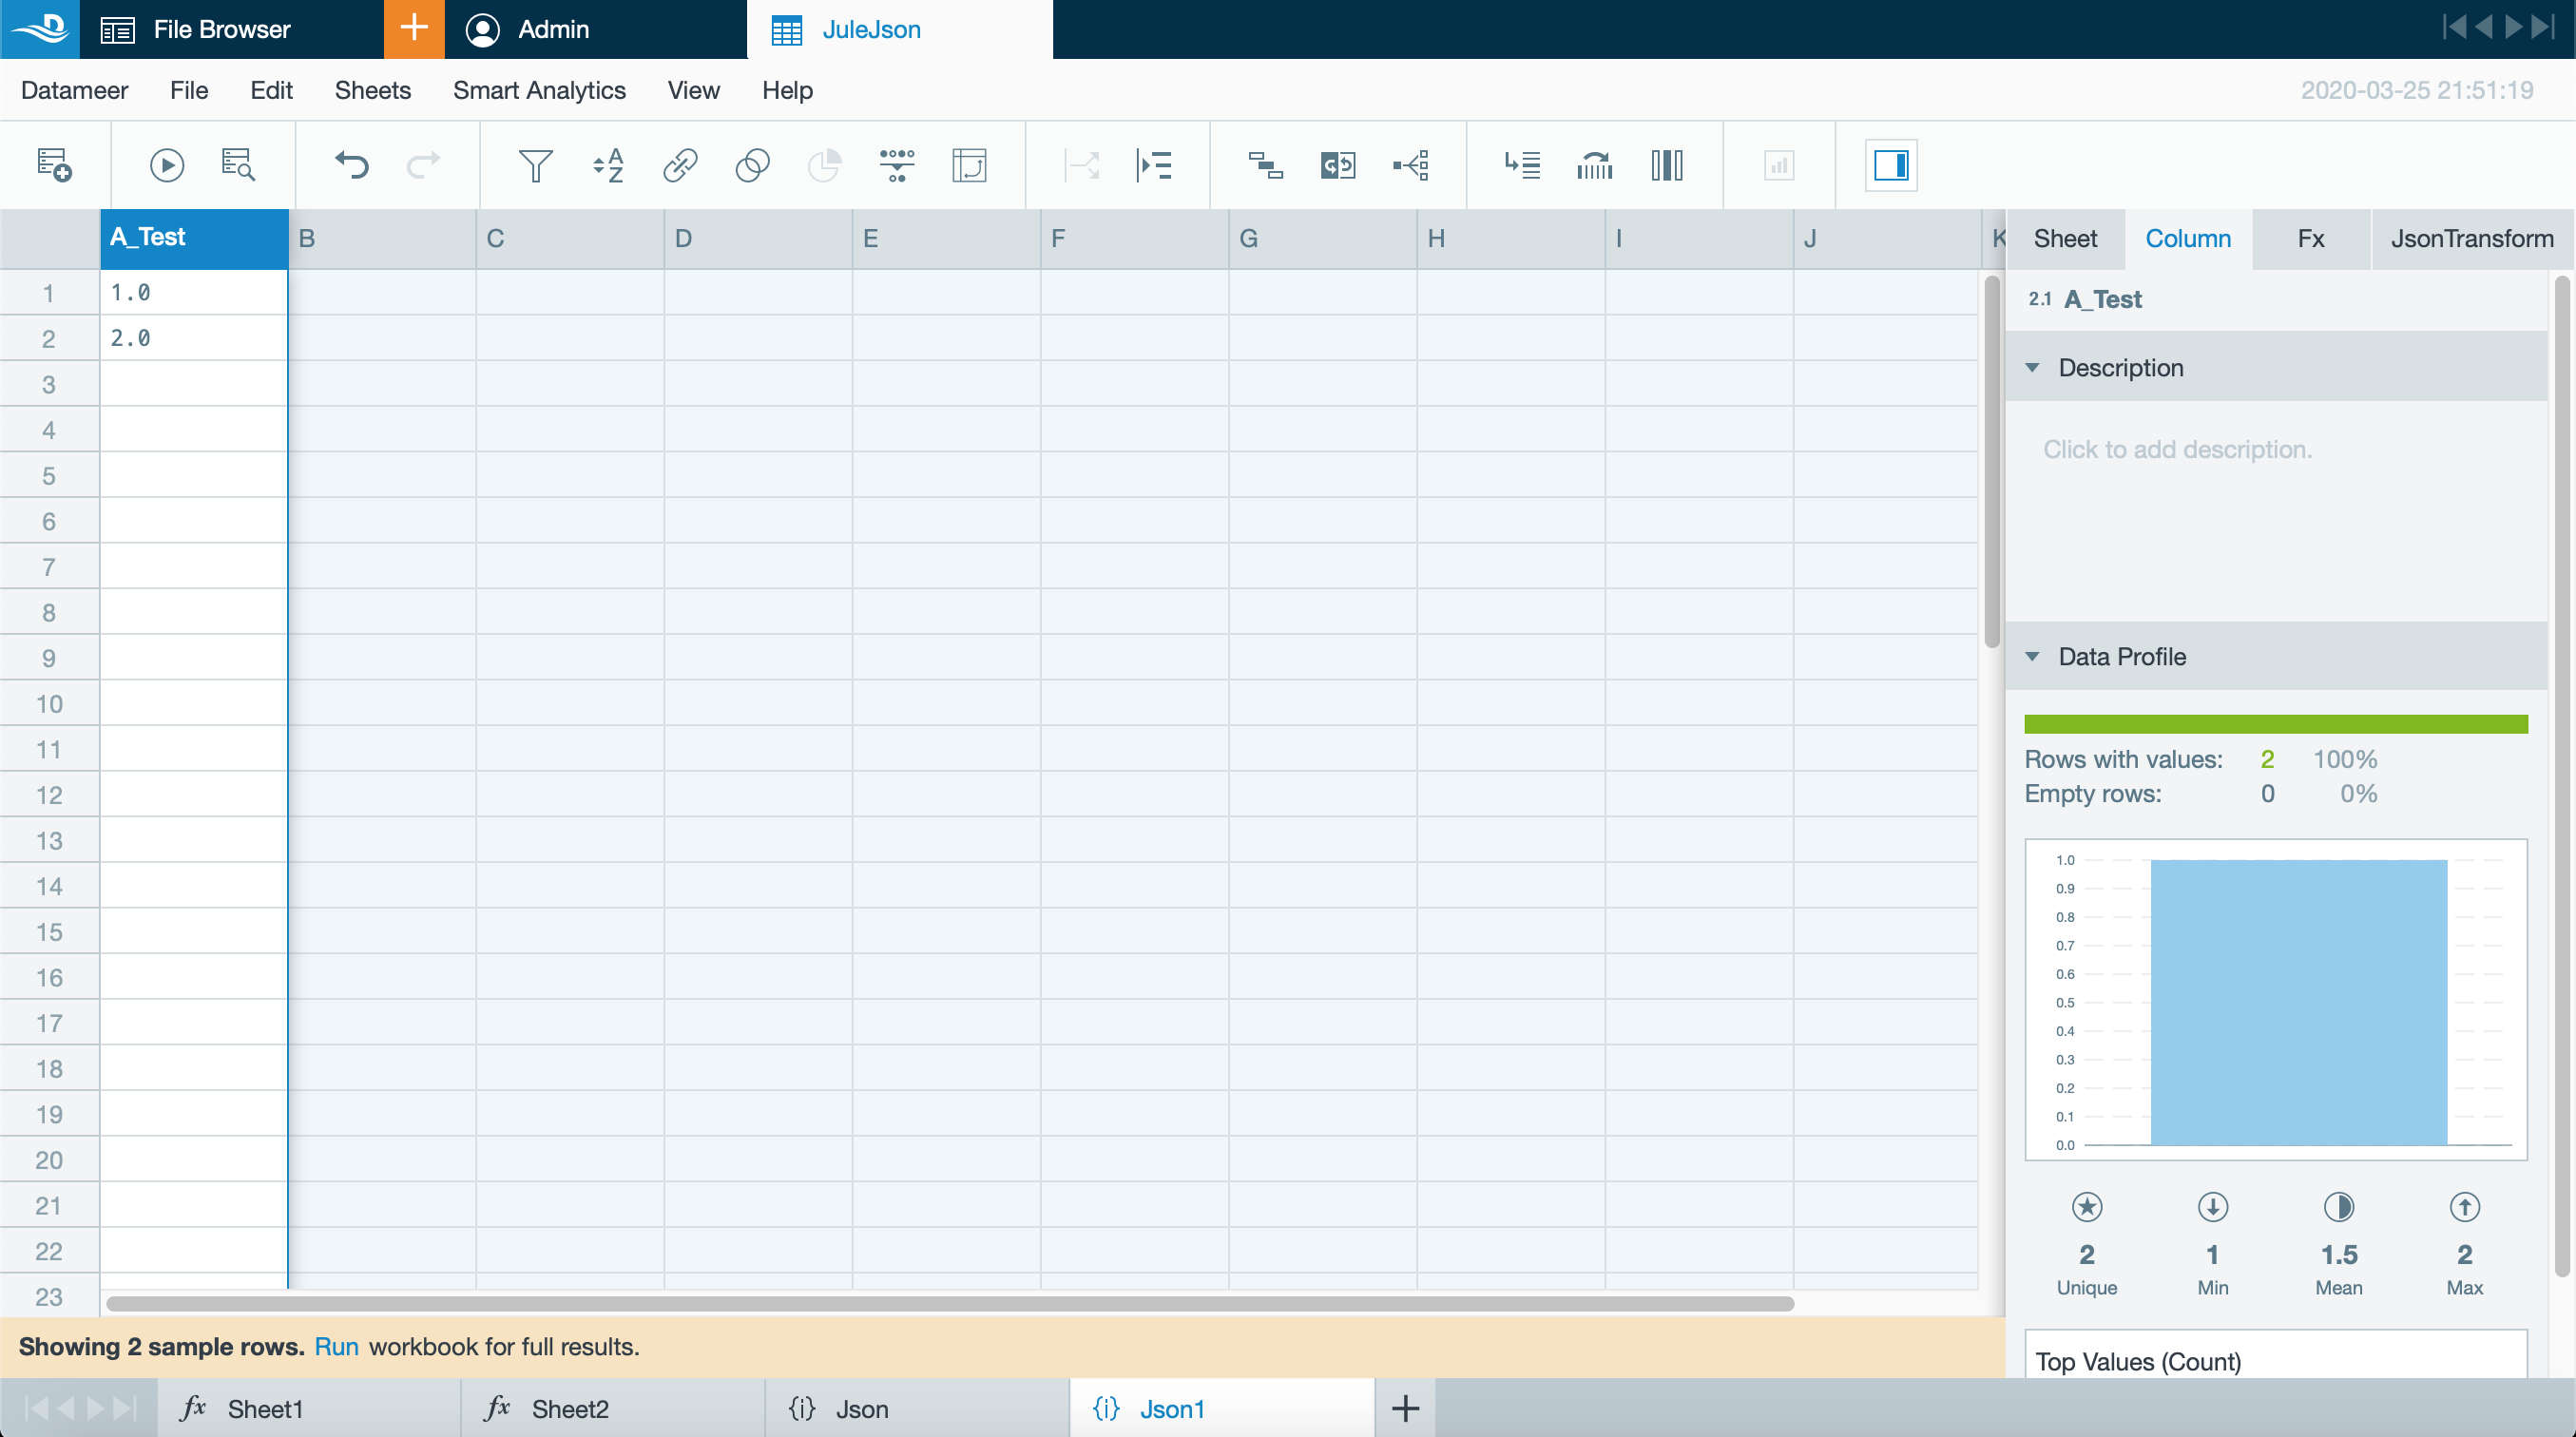
Viewing the Result#
To view the result, confirm your configuration with "Create". The transform sheet with the extracted JSON values appears in the tab bar and is displayed.
INFO: The new column name is prefixed with the source columns name in the new sheet.
Updating JSON#
To update a JSON extraction:
-
Select the tab "JsonTransform" in the Inspector on the right side. The dialog 'JSON Parsing' opens.
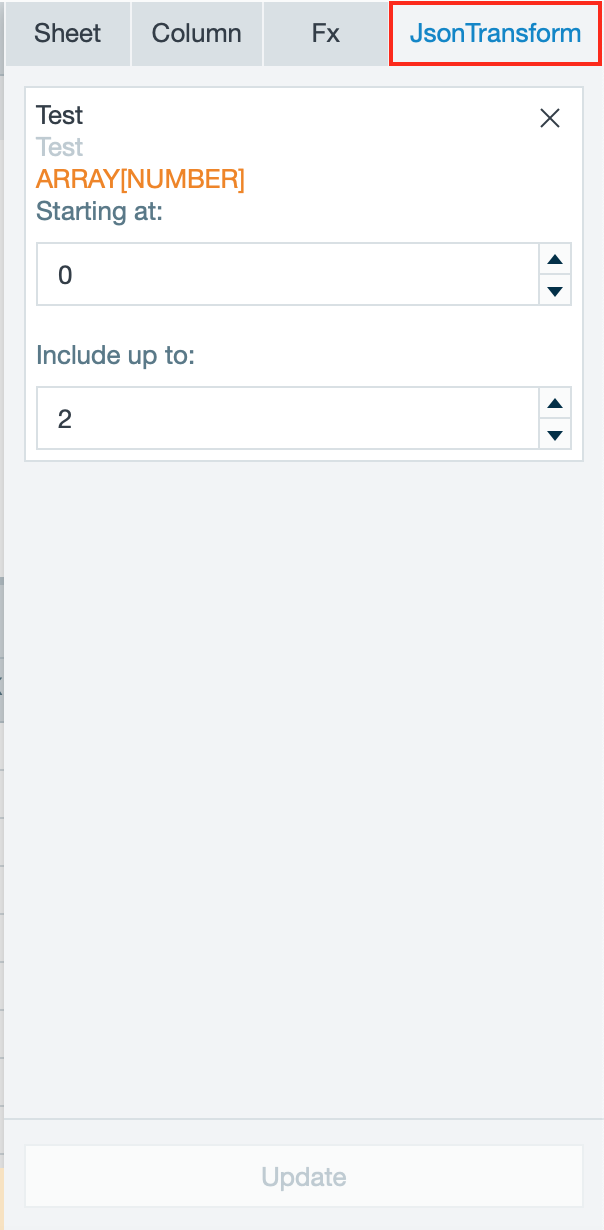
-
Adapt the options to your needs and confirm with "Update". The sheet content adapts to the changes and is displayed.
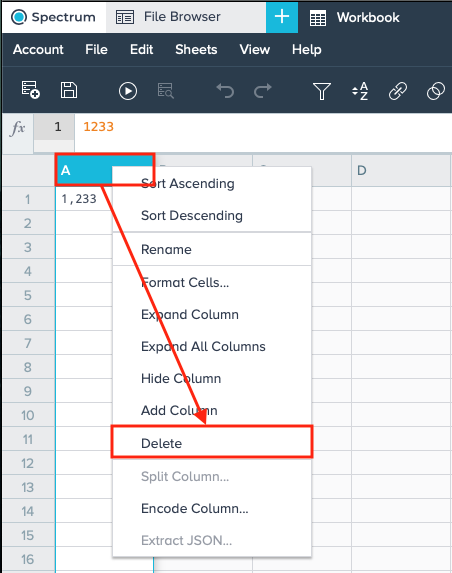
Removing Columns#
To remove a column right-click on a column name and select "Remove Column". The column is removed.
INFO: Column deletion is not possible in a source sheet.
Going to a Line#
To go to a specific record while in the Workbook:
-
From the 'Workbook' menu, select "View" and then "Go to line". The dialog 'Go To Line' opens.
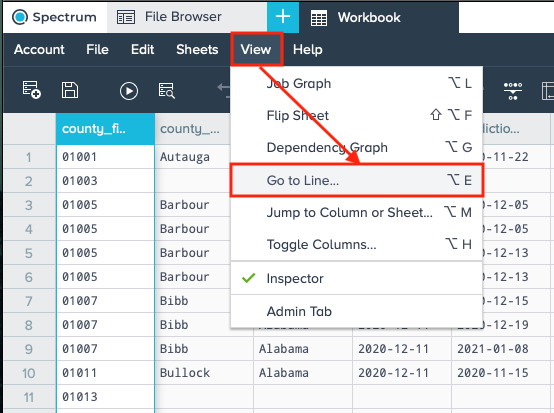
-
Enter the line number and confirm with "Go". The selected line as well as the entries below are displayed.